

Discover the role of predictive analytics in transforming internal tools. Unlock revenue growth and efficiency with proactive decision-making.
TL;DR:
- Embedding predictive analytics into operational workflows enables organizations to proactively act on forecasts and improve key metrics. Success depends on integrating models into decision points like CRMs, ERPs, and content systems, with focus on adoption and data quality. Growth-stage companies should pilot targeted predictions quickly and embed outputs where decisions happen for measurable business impact.
Predictive analytics turns internal tools from passive report generators into proactive decision engines. The role of predictive analytics here is direct: embed probabilistic forecasts into CRMs, ERPs, CMSs, and scheduling systems so your team acts before problems surface, not after. Stanford GSB research links adoption to significant additional sales at sample mean for manufacturing establishments with the right workplace complements. That’s not a dashboard win. That’s operational embedding doing its job.
Key outcomes businesses see when predictions live inside workflows:
- Revenue uplift from lead scoring and next-best-action triggers in CRM
- Reduced downtime via predictive maintenance orders in ERP
- Better content ROI when editorial teams forecast performance before committing budget
What predictive analytics actually does inside admin tools
Four prediction types cover most internal use cases:
- Classification — churn risk flags, fraud alerts, ticket escalation
- Regression — demand forecasting, revenue projection
- Ranking/prioritization — lead scoring, task queues, content triage
- Time-series forecasting — capacity planning, inventory reorder timing
Each type maps to an embedded action. A classification model flags a high-risk account; the CRM auto-routes it to a senior rep. A regression model forecasts content traffic; the CMS surfaces that piece for editorial review. Temporal validation is non-negotiable for any of these — train on past data, test on future data, or your accuracy numbers are fiction.
Predictive analytics shifts organizations from reactive reporting to automated, high-velocity decision-making by embedding forecasts into core operational systems. The firms seeing the biggest gains aren’t running better reports — they’re triggering automated actions the moment a model fires.
For content teams specifically, forecasting content performance before production reduces waste and focuses budget where historical data shows the highest probability of success.
Measurable business benefits and how to calculate ROI
Many organizations that implement predictive analytics report improved forecasting accuracy and cost reduction. The Stanford/Census sample mean for productivity gains is about 1.45%, equating to roughly $464,000–$918,000 in additional sales for manufacturing establishments with IT capital, educated workers, and flow-efficient processes. Without those complements, many firms see no benefit at all.
| Outcome | Metric to track | Simple ROI formula |
|---|---|---|
| Prevented incidents | Cost per incident | Incidents prevented × avg. incident cost |
| Churn reduction | Revenue retained | At-risk accounts saved × avg. contract value |
| Demand forecast accuracy | Forecast error (MAE) | Stockout cost reduction + overstock reduction |
| Content pipeline lift | Qualified leads from content | Lift in leads × avg. lead value |
Frequency matters. A model used daily compounds its value faster than one checked monthly. More importantly, measure decision-change rate — the percentage of times a prediction actually altered what someone did. If your team ignores the score, the model has zero ROI regardless of its accuracy.
Pro Tip: Set a decision adoption KPI from day one. Track what percentage of flagged items triggered a human or automated action. That number tells you more about real-world impact than AUROC ever will.
Where to embed predictive signals in your admin stack
The key operational shift is moving predictions out of standalone dashboards and into the tools where decisions happen. Here’s where that looks like in practice:
- CRM — inline lead scores, next-best-action banners, auto-routing high-value opportunities
- ERP — automated reorder triggers when demand forecasts cross a threshold, preventive maintenance work orders
- CMS — editorial prioritization queues ranked by projected traffic or lead value, personalization rules driven by predicted user intent
- Ticketing/scheduling — triage routing based on predicted resolution time or escalation risk
Surface pattern matters as much as the model itself. Probability scores buried in a side panel get ignored. Scores that reorder a queue or fire a webhook into a workflow engine get acted on. For content teams, analytics in marketing shows how embedding predictions into campaign workflows drives measurably better outcomes than reporting alone.
Pro Tip: Never build a one-off prediction dashboard. Embed the output where the decision lives, and instrument every action taken so you can measure adoption and business lift.

What data and infrastructure you need first
Before any model goes live, check these prerequisites:
- Reliable entity keys (customer ID, product SKU, content slug) consistent across systems
- Event timestamps on every interaction — no timestamps, no time-series features
- Feature windows frozen at prediction time to prevent data leakage
- Accessible labels/targets (did the customer churn? did the lead convert?)
- Documented data lineage so you know what changed and when
Architecture choices come next. Batch processing works for daily lead scoring; streaming is required for real-time fraud detection. A consolidated data warehouse with feature tables beats a tangle of one-off pipelines almost every time. Relational foundation models can cut time-to-prediction from months to minutes by reading raw warehouse tables directly, skipping the feature engineering layer entirely.
Infrastructure milestones in order:
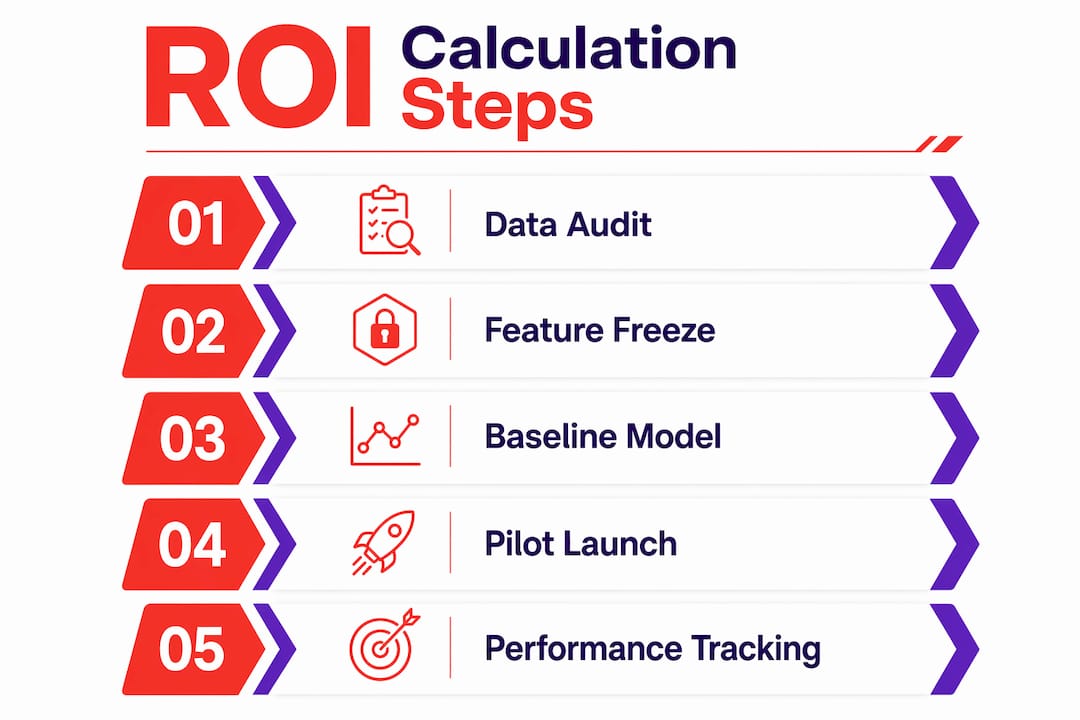
- Data audit — identify gaps in keys, timestamps, and labels
- Feature engineering — build and freeze feature tables
- Baseline model — establish a simple benchmark before adding complexity
- Embed and A/B test — deploy into one workflow, measure lift
- MLOps handoff — retraining schedule, drift monitoring, version control
MLOps, explainable AI, and agentic automation are the three capabilities that keep a model useful after launch. Without them, models drift silently and predictions degrade.
How to run a pilot that proves value fast
A focused pilot beats a broad rollout every time. Six steps:
- Pick one prediction target tied directly to revenue or cost — churn, lead conversion, or content traffic
- Gather and freeze features — pull from your warehouse, document the feature window
- Build a minimally viable model — a gradient-boosted tree or a foundation model zero-shot; skip complexity until you have a baseline
- Embed into one workflow — one CRM queue, one CMS triage view, one ERP trigger
- Run an A/B or canary test — treatment group gets predictions, control group does not
- Measure business lift — revenue delta, cost avoided, adoption rate; then decide to scale or pivot
| Step | Duration | Owner |
|---|---|---|
| Data audit + feature freeze | Weeks 1–2 | Data / Engineering |
| Baseline model build | Weeks 3–4 | Data Science |
| Workflow embed | Weeks 5–6 | Product / Engineering |
| A/B test + measurement | 6–10 weeks | Product / Ops |
KPIs to track: AUROC or MAE for model performance, decision adoption rate (% of predictions acted on), and business impact (revenue uplift or cost avoided).
Pro Tip: Always use a temporal test split — train on earlier data, validate on later data. A random split leaks future information into training and makes your model look far better than it will perform in production.
Common pitfalls and how to avoid them
- The dashboard trap — predictions that live only in reports rarely change behavior; embed outputs into operational workflows
- Model drift — models degrade as data patterns shift; set retraining SLAs and automated drift alerts
- Data leakage — features computed after the prediction time inflate accuracy; freeze features at the moment of prediction
- Misaligned incentives — if reps aren’t rewarded for acting on scores, they won’t; align OKRs to adoption metrics
- No MLOps — a model without versioning, monitoring, and retraining is a liability, not an asset
On governance: minimize PII exposure in feature tables, enforce role-based access on model endpoints, and document model logic for explainability. Users trust predictions they can understand. A black-box score with no rationale gets ignored or gamed.
How to evaluate outside partners and vendors
Checklist for vetting a predictive analytics partner:
- Connects directly to your data warehouse and exposes predictions via API or webhooks
- Provides MLOps support: retraining schedules, drift detection, version control
- Offers explainability tooling so end users understand why a score fired
- Has documented SLAs for latency and uptime on model serving endpoints
- Demonstrates measurable business impact from past engagements (anonymized, with real metrics)
- Clear data ownership terms — your data stays yours
Questions to ask every vendor:
- How do you instrument decision adoption after deployment?
- What triggers a model retraining, and who owns that process?
- Can you connect to our warehouse and surface predictions in our existing UI?
Score proposals on: technical fit with your stack, data ownership clarity, ability to embed into operational workflows (not just deliver a dashboard), and demonstrated ROI from comparable use cases. Weight measurable outcomes over feature lists.
What Rule27design has seen building these systems
Two patterns show up consistently in Rule27design’s work on custom internal tools.
A growth-stage operations team came in with a manual ticket triage process eating 15+ hours per week. Rule27design embedded a classification model into their admin panel that auto-prioritized tickets by predicted resolution complexity. The team’s operational efficiency improved by 40% within the first quarter after launch. The key factor: predictions surfaced inside the queue, not in a separate report.
A content team needed to justify editorial spend to finance. Rule27design built a CMS layer that scored content ideas by projected traffic and lead value before production started. Budget shifted toward high-probability pieces. Qualified leads from content climbed measurably within two editorial cycles.
The difference in both cases wasn’t the model. It was where the output lived. Embed the prediction where the decision happens, and adoption follows naturally.
Key Takeaways
Predictive analytics delivers measurable ROI only when forecasts are embedded directly into operational workflows, not isolated in dashboards.
| Point | Details |
|---|---|
| Embed, don’t report | Predictions in queues and workflows get acted on; dashboard-only outputs rarely change behavior. |
| Prerequisites matter | Reliable entity keys, event timestamps, and frozen feature windows are required before any model goes live. |
| Pilot first, then scale | A 6–10 week A/B pilot with one prediction target proves value before broader investment. |
| Measure adoption, not just accuracy | Track the percentage of predictions that triggered an action — that’s your real ROI signal. |
| Rule27design builds these systems | Rule27design embeds predictive outputs into custom admin panels and CMSs, with clients seeing operational efficiency improve by up to 40% within the first quarter after launch. |
What actually matters here
The conventional wisdom says “get your data clean first, then build models.” That’s often a trap. Data is never perfectly clean. The smarter move is to pick one high-value prediction target, get a minimally viable model into one workflow, and measure what changes. The Stanford productivity finding is compelling, but it comes with a condition: workplace complements (IT capital, educated staff, efficient processes) are required. Without them, the model sits unused and the ROI is zero. Growth-stage companies often underestimate this. The tool isn’t the hard part. Getting your team to act on the output is.
Rule27design can scope your pilot in days
Rule27design builds the custom admin panels, CMSs, and internal tools that make predictive outputs actually usable. Not a dashboard bolted on top. The prediction lives in the queue, the workflow, the trigger — where your team already works.

The typical engagement starts with a short discovery to scope a 6–10 week pilot: one prediction target, one embedded workflow, measurable lift. Rule27design handles the architecture, the embed, and the measurement layer. Clients often see substantial improvement in operational efficiency after implementation. If you’re ready to move from reactive reporting to embedded prediction, start the conversation with Rule27design today.
Sources and further reading
- Stanford GSB — The Power of Prediction — primary evidence for productivity gains and workplace complement requirements
- MIT DSpace — parallel analysis — supports causal interpretation and complement conditions
- LatentView AI — predictive analytics use cases — operational embedding, MLOps, and agentic automation
- Kumo.ai — relational foundation models guide — architecture evolution and time-to-prediction benchmarks
- Kumo.ai FAQ — model types, evaluation metrics, temporal validation
- TrySight — predictive content performance — content ROI forecasting and editorial prioritization
- Predictive Marketing — content analytics guide — data stack consolidation for content teams
- EMAN Research — IT-enabled predictive analytics — adoption rates and sectoral benchmarks
- IBM — what is predictive analytics — foundational model types and industry applications
Further reading for technical teams: MLOps documentation (MLflow, Evidently), explainable AI frameworks (SHAP, LIME), and the Kumo.ai enterprise guide for relational foundation model architecture.
Further reading for product teams: Rule27design’s AI-driven analytics guide for BI professionals and the AI-powered marketing ROI breakdown for content and campaign embedding patterns.
Topics

About the Author
Josh AndersonCo-Founder & CEO at Rule27 Design
Operations leader and full-stack developer with 15 years of experience disrupting traditional business models. I don't just strategize, I build. From architecting operational transformations to coding the platforms that enable them, I deliver end-to-end solutions that drive real impact. My rare combination of technical expertise and strategic vision allows me to identify inefficiencies, design streamlined processes, and personally develop the technology that brings innovation to life.
View Profile

