

Discover essential content marketing KPIs that drive real results. Focus on key metrics to optimize your strategy and boost performance.
Your content team is busy. But busy doesn’t mean effective. The fastest way to fix that gap: adopt a five-lane KPI set covering Reach, Engagement, Authority, Conversion, and Efficiency, then pick 1–2 metrics per lane. That’s it. No 40-metric dashboards. No vanity reporting. Just a compact scoreboard that tells you what to publish next and where to spend budget.
Here’s your minimum viable 10-metric set to get started:
- Organic sessions (Reach — GA4)
- Impressions and CTR (Reach — Google Search Console)
- Average engagement time (Engagement — GA4)
- Scroll depth at 75%+ (Engagement — GA4 custom event)
- Backlinks earned (Authority — Ahrefs/GSC)
- Content-assisted conversions (Conversion — GA4 + CRM)
- MQL→SQL conversion rate (Conversion — HubSpot or Salesforce)
- Cost per qualified lead (Efficiency — CRM + finance)
- Content-attributed pipeline (Efficiency — CRM)
- Cost per influenced opportunity (Efficiency — CRM + finance)
Four next steps to get this running within 30 days:
- Apply a consistent UTM naming convention across every new content asset.
- Instrument GA4 scroll-depth events (fire at 25%, 50%, 75%, 100%) and custom CTA click events.
- Tag content in your CRM (HubSpot or Salesforce) for first-touch attribution so leads tie back to specific pieces.
- Set a weekly 90-minute action review on leading indicators and a monthly trend report on lagging outcomes.
Key Takeaways
Effective content marketing measurement comes down to one discipline: pick 1–2 KPIs per funnel lane, instrument them correctly in GA4 and your CRM, and review leading indicators weekly so you’re making decisions on current signals, not last quarter’s data.
| Point | Details |
|---|---|
| Five-lane KPI framework | Organize metrics across Reach, Engagement, Authority, Conversion, and Efficiency — 1–2 KPIs per lane. |
| 10-metric scoreboard | The minimum viable set covers organic sessions, CTR, engagement time, scroll depth, backlinks, assisted conversions, MQL→SQL rate, cost per lead, pipeline, and cost per opportunity. |
| UTM discipline first | Consistent UTM naming and CRM first-touch tagging is the single highest-ROI measurement habit before any attribution model. |
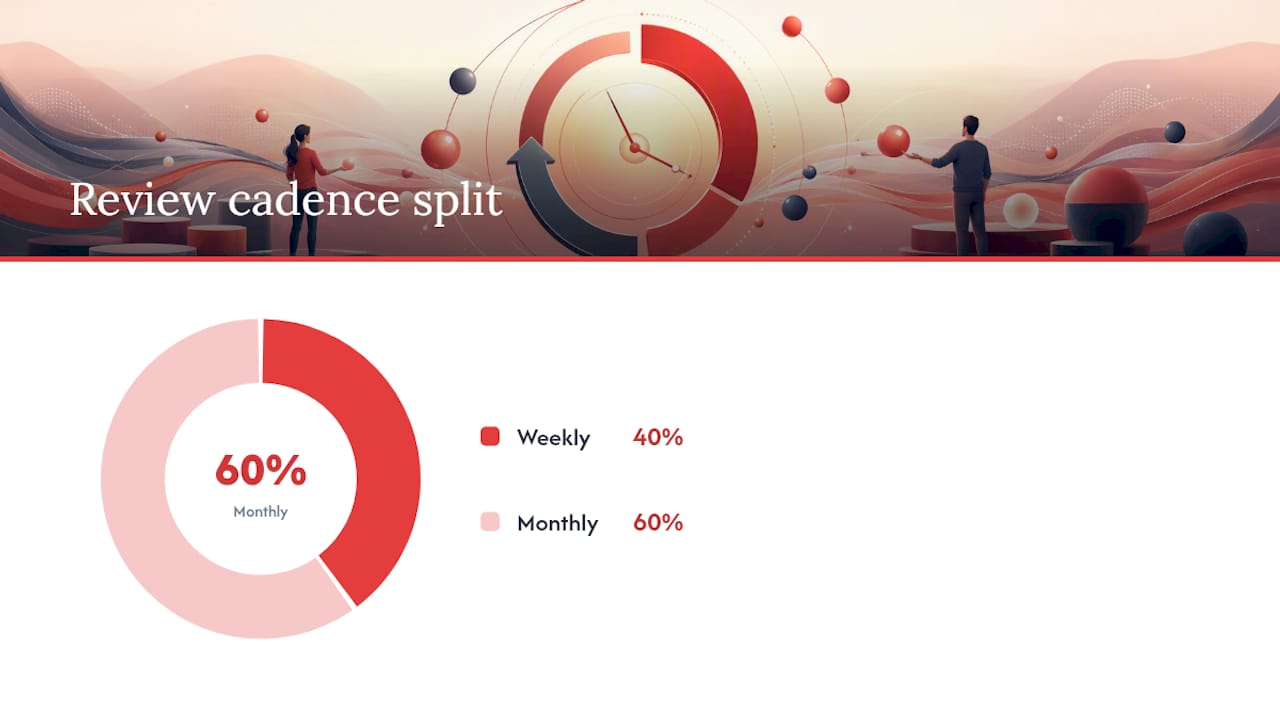
| Weekly vs. monthly cadence | Review leading indicators (Reach, Engagement) weekly for actions; review lagging outcomes (Conversion, Efficiency) monthly for trends. |
| Rule27design measurement audit | Rule27design audits GA4 instrumentation, CRM tagging, and dashboard setup to move teams from vanity reporting to pipeline attribution in 30 days. |
What makes a content marketing KPI actually useful?
A metric becomes a KPI when it’s tied to a specific business objective, has a target, and has someone reviewing it on a set cadence. Pageviews are a metric. Content-attributed pipeline is a KPI. The difference isn’t the data point itself — it’s whether the number changes a decision.
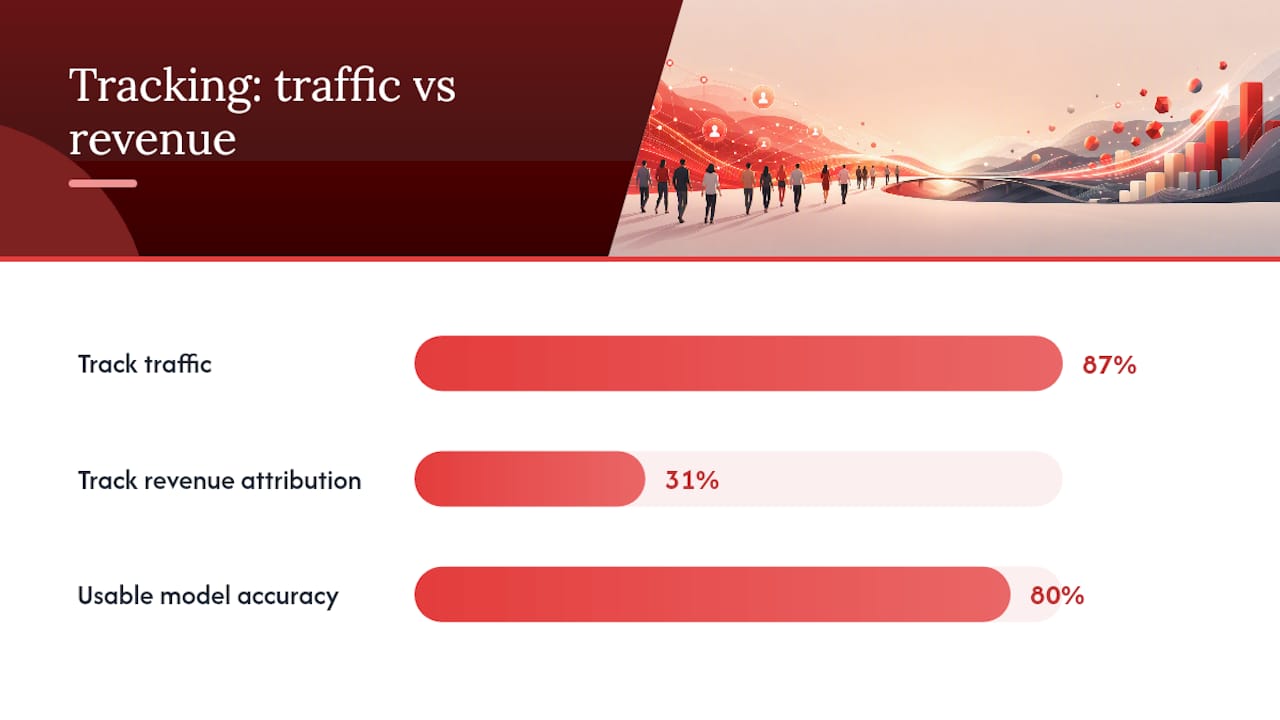
Most teams fall into what practitioners call “KPI zoo”: a sprawling list of metrics that looks thorough but drives no action. According to Revenue Memo, 87% of content teams track traffic while only 31% track revenue attribution. That gap is the measurement problem in one stat.
A good content KPI passes five tests:
- Measurable — you can pull it from GA4, Google Search Console, HubSpot, Salesforce, or another named source on a regular schedule.
- Linked to strategy — it connects to a department or organizational objective, not just content activity.
- Actionable — a change in the number tells you what to do next (publish more, update the CTA, fix a landing page).
- Within team influence — your content team can actually move it, not just observe it.
- Clearly owned — one person is responsible for reviewing it and flagging when it moves.
The five-lane framework for content marketing KPIs
CMI’s 5-stage measurement framework makes the same core argument: organize KPIs across the content journey so you’re not over-reporting on reach while ignoring conversion signals. The five-lane model maps directly to that logic.
Each lane answers a different question and feeds a different decision:
- Reach — Are the right people finding your content? Primary data source: GA4 + Google Search Console. Informs publishing frequency and topic prioritization.
- Engagement — Are they actually reading it? Primary source: GA4 (engagement time, scroll depth). Informs content quality and format decisions.
- Authority — Is your content building credibility over time? Primary source: GSC keyword rankings, backlink tools. Informs SEO investment and link-building priorities.
- Conversion — Is content moving people toward a business outcome? Primary source: GA4 goals + CRM (HubSpot/Salesforce). Informs CTA strategy and content mix.
- Efficiency — Are you getting enough output for the cost? Primary source: CRM + finance. Informs budget allocation and production decisions.
The leading vs. lagging split matters here. Reach and Engagement metrics are leading indicators — they move first and predict what’s coming. Conversion and Efficiency metrics are lagging outcomes — they confirm what already happened. Authority sits in the middle: keyword rankings move slowly but predict future Reach. Scoop Analytics recommends reviewing leading indicators weekly for actions and lagging outcomes monthly for trends. That cadence keeps the team responsive without chasing noise.
| Lane | Primary Question | Leading or Lagging | Data Source | Review Cadence |
|---|---|---|---|---|
| Reach | Are the right people finding us? | Leading | GA4, Google Search Console | Weekly |
| Engagement | Are they reading and staying? | Leading | GA4 (events, engagement time) | Weekly |
| Authority | Is credibility building? | Mixed | GSC rankings, backlink tools | Monthly |
| Conversion | Is content driving business outcomes? | Lagging | GA4 goals, HubSpot/Salesforce | Monthly |
| Efficiency | Are we spending wisely? | Lagging | CRM, finance/ops | Monthly |
Specific KPIs for each funnel stage and how to calculate them
Reach: top-of-funnel visibility
Organic sessions — pull from GA4 under Traffic Acquisition. Filter by “Organic Search” as the session source. Track week-over-week and month-over-month growth rate, not raw volume.
Impressions and search CTR — Google Search Console’s Performance report. CTR formula: clicks ÷ impressions. A low CTR on high-impression queries signals a title or meta description problem, not a content problem.
Organic traffic growth rate — [(current period sessions − prior period sessions) ÷ prior period sessions] × 100. The Seo Engine identifies this as one of the top predictors of content ROI alongside assisted conversions and content-attributed pipeline.
Engagement: mid-funnel attention
Average engagement time — GA4’s native metric, replacing the old average session duration. It measures time the page was actually in focus. Anything above 2 minutes on a long-form post is a solid signal. Marketful’s funnel-stage KPI guide notes that engagement time and scroll depth correlate better with downstream conversions than legacy bounce rate ever did.
This tells you whether readers are reaching your CTAs at all.
Return visitor rate — GA4 under User Acquisition. A rising return rate on a content hub signals growing audience loyalty, not just search traffic.
Authority: SEO momentum
Priority keywords in top SERP positions — track a defined list of 20–50 target keywords in GSC or a tool like Semrush. Watch position movement monthly. A cluster of keywords moving from positions 11–20 into the top 10 is a leading signal that organic sessions will rise in 4–8 weeks.
Backlinks earned (quality-weighted) — total new referring domains from authoritative sources. Raw link count is less useful than the number of links from domains with real editorial standards. Review monthly. For SEO authority KPIs, domain-level link growth is one of the most reliable long-term signals.
Conversion: business impact
Content-assisted conversions — GA4’s attribution reports show which pages appeared in the conversion path without being the last touch. This is the metric that proves content’s influence even when it doesn’t close the deal directly.
MQL→SQL conversion rate — (SQLs sourced from content-touched leads ÷ MQLs from content) × 100. Pull from HubSpot or Salesforce. If this rate is low, the content is attracting the wrong audience or the handoff process is broken.
Micro-conversions — newsletter signups, demo clicks, pricing page visits. Track as GA4 custom events. These are early signals of intent before a lead enters the CRM.
Efficiency: operational cost
Cost per qualified lead — total content production and distribution cost ÷ number of qualified leads attributed to content. Requires CRM tagging and a cost-allocation method (see Section 7).
Cost per influenced opportunity — total content spend ÷ number of pipeline opportunities where content appeared in the path. This is the efficiency metric that CFOs actually respond to.
| KPI | Formula | Source | Cadence |
|---|---|---|---|
| Organic sessions | Raw count, filter by organic source | GA4 | Weekly |
| Search CTR | Clicks ÷ impressions | Google Search Console | Weekly |
| Avg engagement time | Native GA4 metric | GA4 | Weekly |
| Scroll depth 75%+ | Custom event count | GA4 + GTM | Weekly |
| Backlinks earned | New referring domains | GSC + backlink tool | Monthly |
| Content-assisted conversions | Conversion path appearances | GA4 attribution | Monthly |
| MQL→SQL rate | SQLs ÷ MQLs from content | HubSpot/Salesforce | Monthly |
| Cost per qualified lead | Total spend ÷ qualified leads | CRM + finance | Monthly |
How do you pick the right KPIs for your objective?
Start with the cascade. ClearPoint’s alignment framework runs from organizational objective down to team KPI: the company wants to grow pipeline by 30%, the marketing department owns 40% of that pipeline target, the content team owns a share of marketing’s contribution. Every KPI you track should trace back up that chain. If it doesn’t, drop it.
SMART objective template:
“Increase content-attributed MQLs from 45 to 75 per month by Q4, measured weekly in HubSpot, owned by the content lead.”
From that one objective, you’d pick:
- A leading indicator: organic sessions to content-attributed landing pages (weekly).
- A lagging outcome: MQL count from content-sourced leads (monthly).
That’s two KPIs for one objective. Done.
Rules to follow:
- One to two KPIs per lane. More than that and you’re measuring activity, not outcomes.
- Every objective needs at least one leading indicator and one lagging outcome. Leading metrics tell you if the work is happening; lagging metrics tell you if it worked.
- Avoid orphan metrics — numbers nobody reviews and nobody acts on. If a metric doesn’t appear in a weekly or monthly review, delete it from the dashboard.
- Review leading indicators weekly for quick pivots. Review lagging outcomes monthly to spot trends without overreacting to noise.
Numbered decision process:
- Write the business objective in one sentence with a number and a deadline.
- Identify which lane it lives in (Reach, Engagement, Authority, Conversion, or Efficiency).
- Pick one leading indicator from that lane.
- Pick one lagging outcome from that lane.
- Assign an owner and a review date.
- Set a baseline from the last 90 days of data.
- Set a target that’s a 20–30% stretch from baseline.
For teams building a data-driven content strategy, this cascade process is the single highest-leverage planning step before any content gets written.
What does a minimum viable measurement system look like?
The 10-metric scoreboard from the opening section isn’t arbitrary. Each metric earns its place by enabling a specific decision. Chief Content Marketer’s Content ROI Playbook describes a Tier 1–4 progression from consumption metrics to revenue attribution — and the 10-metric set covers all four tiers in a manageable package.
Here’s why each metric is on the list:
- Organic sessions — tells you if distribution is working.
- Impressions and search CTR — tells you if titles and topics are resonating in search.
- Average engagement time — tells you if content quality is holding attention.
- Scroll depth 75%+ — tells you if readers are reaching your CTAs.
- Backlinks earned — tells you if content is building authority.
- Content-assisted conversions — tells you if content is influencing the buyer journey.
- MQL→SQL rate — tells you if content is attracting the right audience.
- Cost per qualified lead — tells you if content is efficient at lead generation.
- Content-attributed pipeline — tells you the revenue impact of content.
- Cost per influenced opportunity — tells you the efficiency of content across the full pipeline.
For a sample dashboard, custom dashboards built in Looker Studio typically split these into two views: a weekly action panel (Reach + Engagement leading indicators) and a monthly business review panel (Conversion + Efficiency lagging outcomes).
| Dashboard Panel | Metrics Included | Owner | Cadence |
|---|---|---|---|
| Weekly action review | Organic sessions, CTR, engagement time, scroll depth | Content lead | Weekly |
| Monthly business review | Assisted conversions, MQL→SQL rate, cost per lead, pipeline | Marketing director | Monthly |
| Authority tracker | Backlinks, keyword positions | SEO lead | Monthly |
How do you set up GA4, GSC, UTMs, and CRM tracking correctly?
Getting the instrumentation right is where most teams lose attribution. Here’s the exact setup sequence:
GA4 setup:
- Enable enhanced measurement in GA4 Admin — this captures scroll events natively (though only at 90%, not at 25/50/75).
- Create custom scroll-depth events in Google Tag Manager: fire at 25%, 50%, 75%, and 100% using the built-in scroll depth trigger.
- Create custom events for CTA clicks (demo buttons, newsletter signups, pricing page visits) using GTM click triggers.
- Configure data-driven attribution in GA4’s Attribution Settings if you have sufficient conversion volume (GA4 requires a minimum conversion threshold before this model activates).
- Set up GA4 Explorations for content-path analysis to see which pages appear most in assisted conversion paths.
Google Search Console:
- Verify your property and connect it to GA4 via the GSC linking feature.
- Set up a weekly check on your 20–50 priority keywords using the Performance report filtered by query.
- Export position data monthly to a tracking spreadsheet to spot trend lines that the GSC interface smooths over.
UTM taxonomy:
Consistent UTM naming is the single most important instrumentation habit. A broken UTM convention means leads arrive in the CRM with no source data, and attribution collapses. Use this structure:
utm_source: platform (google, linkedin, newsletter)utm_medium: channel type (organic, cpc, email)utm_campaign: campaign name (q3-ebook-launch)utm_content: specific asset (blog-post-title or cta-variant)
Keep a shared UTM spreadsheet (Google Sheets works fine) where every new asset gets its UTM string logged before publishing. CommsWith.AI’s measurement framework identifies UTM discipline as the central habit that makes attribution credible.
CRM integration (HubSpot/Salesforce):
- Map UTM parameters to CRM contact fields on form submission. HubSpot does this natively with hidden form fields; Salesforce requires a custom field mapping or a tool like Zapier.
- Tag every content-sourced lead with the original content piece (first-touch) at the point of conversion.
- Export content-source fields monthly to Looker Studio for pipeline reporting.
Looker Studio dashboard:
Connect GA4 and your CRM export as data sources. Build two pages: the weekly action panel and the monthly business review. Use GA4’s native Looker Studio connector for real-time data; use a scheduled CRM export (CSV or BigQuery) for pipeline metrics.
Pro Tip: Use server-side tagging in Google Tag Manager where possible. Client-side tags get blocked by ad blockers and browser privacy settings at a meaningful rate, which means you’re losing attribution on a portion of your traffic. Server-side capture reduces that loss significantly.
How do you connect content to pipeline and revenue?
Only 31% of content teams track revenue attribution while 87% track traffic. That gap exists because connecting content to pipeline feels hard. It doesn’t have to be.
Start with micro-conversions. A newsletter signup, a demo click, a pricing page visit — these are intent signals that happen before a lead enters the CRM. Track them as GA4 custom events. They give you a leading indicator of pipeline influence before you have enough CRM data to run attribution models.
Influence window: set a 30–90 day window for content influence. If a prospect visited a blog post within 90 days before converting, that content gets credit in the influence model. Start with 30 days if your sales cycle is short; extend to 90 days for enterprise deals.
First-touch attribution calculation:
- In HubSpot or Salesforce, filter all deals closed in a period by “original source = content.”
- Sum the deal values. That’s your content-attributed pipeline for the period.
- Divide by total content spend for the same period to get content ROI.
Chief Content Marketer’s ROI Playbook makes the point directly: an 80% accurate model you actually use beats a perfect multi-touch model you never implement. Start with first-touch. It’s fast, it’s credible, and it gets the conversation started with leadership.
Once UTM discipline is consistent and CRM tagging is reliable, you can migrate to a linear or time-decay multi-touch model. That migration typically takes 12–18 months of consistent data collection before the numbers are decision-grade. For teams looking to measure sales content performance more precisely, the CRM tie is the non-negotiable first step.
Stat to know: Revenue Memo reports that only 31% of content teams track revenue attribution. If your team is in that minority, you have a significant competitive reporting advantage over peers who are still presenting traffic slides to the CFO.
What do you do when your KPIs move in the wrong direction?
A metric change is only useful if it triggers a specific action. Here’s the diagnostic flow:
Step 1: Check instrumentation first. Before assuming a content problem, verify the data. Did a GTM tag break? Did UTM strings get dropped from a campaign? Did someone change the GA4 event name?
Step 2: Check traffic source. If organic sessions dropped, open GSC and check for position drops on priority keywords. A Google algorithm update, a competitor gaining links, or a technical SEO issue (crawl errors, indexing problems) can tank sessions with no content quality change.
Step 3: Check content-intent match. If sessions are stable but engagement time is dropping, the content isn’t matching what searchers expected. Review the top queries driving traffic to that page in GSC and compare them to the content’s actual angle.
Step 4: Check CTA effectiveness. Good traffic and good engagement time but no conversions? The CTA is the problem. Test placement (above the fold vs. end of article), copy, and offer.
Step 5: Check landing experience. If CTA clicks are happening but form completions are low, the landing page is the bottleneck, not the content.
Common scenarios and immediate actions:
- Declining organic sessions: check GSC for position drops on top 10 queries; run a crawl audit; check for recent algorithm updates affecting your content category.
- Low engagement time (under 60 seconds on long-form): review content format and opening paragraph; check if mobile load speed is causing early exits.
- Good traffic, no leads: audit CTAs for relevance to the content topic; add a mid-content offer that matches the reader’s stage; check if the lead form is functional.
- High MQL volume, low MQL→SQL rate: the content is attracting the wrong audience; review which topics and keywords are sourcing those MQLs and adjust targeting.
Funnel-stage KPI analysis consistently shows that teams who run this diagnostic sequence weekly catch problems in days rather than months.
Which KPIs fit which content type?
Not every piece of content should be measured the same way. A blog post targeting a top-of-funnel search query has a different job than a case study sitting on a sales enablement page.
| Content Type | Primary Goal | Best KPIs | Common Mistake | Recommended Next Action |
|---|---|---|---|---|
| SEO blog post (TOFU) | Organic discovery | Organic sessions, impressions, CTR | Tracking only pageviews, ignoring CTR | Optimize title tags for CTR; add mid-content CTA |
| Case study (BOFU) | Pipeline influence | Content-assisted conversions, pipeline influence | Not tagging in CRM; measuring only pageviews | Add UTM to all case study links; tag in CRM as BOFU asset |
| Webinar / video | Engagement + lead gen | Registration rate, watch time, MQL conversion | Measuring registrations only, not attendance or post-event actions | Track watch time in platform; add post-webinar email sequence with UTMs |
| Help / support article | Retention + deflection | Return visitor rate, avg engagement time, support ticket deflection rate | Ignoring these entirely in content KPI reporting | Add to GA4 content group; track return visits separately from acquisition content |
| Newsletter | Audience loyalty | Open rate, click rate, content-attributed sessions | Treating open rate as the primary KPI | Track UTM-tagged clicks back to GA4; measure sessions and conversions from email source |
For video content specifically, watch time and view-to-conversion rate are the metrics that matter most. YouTube marketing KPI guidance follows the same lane logic: Reach (views, impressions), Engagement (watch time, click-through rate), Conversion (link clicks, form completions from video CTAs).
Expect conversion signals to appear at different speeds by content type. A TOFU blog post may take 60–90 days to rank and generate leads. A case study shared in a sales email can influence a deal within days. Build your attribution windows accordingly.
Who owns each KPI and how do you keep data clean?
Measurement programs fail when nobody owns the numbers. Here’s a simple role structure:
Data quality checklist (run monthly):
- UTM consistency audit: pull all sessions in GA4 with “direct” source and check if any are actually tagged campaigns with broken UTMs.
- Event firing validation: use GA4 DebugView or GTM Preview to confirm scroll-depth and CTA events are firing correctly on key pages.
- CRM tagging audit: spot-check 20 recent leads in HubSpot or Salesforce to confirm content-source fields are populated.
- Duplicate filter check: confirm GA4 filters exclude internal IP addresses and bot traffic.
- Attribution window review: confirm the influence window in CRM reports matches the agreed 30–90 day standard.
A metric moving consistently for three weeks is a signal. Define in advance what constitutes a pivot (budget reallocation, content strategy change) vs. an experiment (A/B test a CTA, update a title tag). Pivots require sign-off from the marketing director; experiments can be run by the content lead without approval. That distinction prevents both paralysis and chaos.
ClearPoint’s cascade alignment model recommends pairing leading and lagging indicators precisely so governance decisions have both early warning signals and confirmed outcomes before a major pivot is called.
How automation speeds up reliable KPI measurement
Manual measurement is slow and error-prone. The teams that get the most from their KPI programs are the ones that automate the repetitive parts.
Three automation patterns that make the biggest difference:
- KPI threshold alerts — set GA4 or Looker Studio alerts to notify the content lead when organic sessions drop more than 15% week-over-week, or when a key conversion event stops firing. Catching a broken tag in 24 hours beats discovering it in the monthly review.
- Auto-refresh dashboards — Looker Studio dashboards connected to GA4 and a CRM data export update automatically. No manual data pulls, no spreadsheet errors. The weekly action review becomes a 20-minute read, not a 2-hour data exercise.
- Content-refresh workflows triggered by KPI decline — when a blog post’s organic sessions drop below a threshold for three consecutive weeks, an automated workflow flags it for a content audit. Rule27design’s automation capabilities include CMS hooks that trigger these workflows without manual monitoring.
Server-side event capture reduces attribution loss from ad blockers and browser privacy settings. CMS-level UTM enforcement (where the CMS auto-appends UTM strings to outbound links) eliminates the human error that breaks attribution chains. AI-powered content checklists can also enforce instrumentation standards at the point of content creation, before a piece ever goes live.
Pro Tip: Build a “measurement health” check into your content publishing workflow. Before any piece goes live, confirm: UTM string logged, GA4 events verified in DebugView, CRM content tag assigned. Five minutes at publish beats two hours of forensic attribution work later.
The Seo Engine’s practitioner framework recommends filtering metrics by decision impact and automating the routine checks so the team’s attention stays on the signals that change what gets published next.
What most content teams get wrong about measurement
The most common mistake isn’t picking the wrong KPIs. It’s measuring activity instead of outcomes. Teams track how many posts they published, how many social shares they got, how many email opens they recorded. Those numbers feel productive. They don’t tell you if content is working.
The single process change with the highest return: UTM discipline tied to CRM first-touch tagging. Not a new tool. Not a fancier dashboard. Just consistent UTM strings on every asset and a CRM field that captures where each lead first found you. That habit alone moves a team from “we think content is working” to “content sourced $X in pipeline this quarter.”
Two lessons from running measurement programs:
First, prioritize first-touch tagging before you build any attribution model. You can’t run multi-touch attribution on leads that arrived with no source data. Get the tagging right for 90 days, then worry about model sophistication.
Second, the weekly 90-minute KPI review is the highest-leverage meeting in the content calendar. Not a status update. A decision meeting. The agenda: which leading indicators moved, what’s the hypothesis for why, and what’s the one action the team takes this week. Teams that run this meeting consistently make better content decisions than teams with better tools but no review cadence.
Rule27design can build your measurement system in 30 days
Getting your content KPIs from spreadsheet chaos to a clean, decision-grade system is faster than most teams expect — when the instrumentation is done right the first time.
Rule27design builds custom GA4 instrumentation, CRM integration (HubSpot and Salesforce), and Looker Studio dashboards that connect your content performance to pipeline data. The starting point is a short measurement audit that identifies your top three instrumentation gaps and delivers a 30-day implementation plan to fix them.

Growth-stage teams that have outgrown their basic analytics setup but aren’t ready for enterprise BI tools are exactly who this is built for. The audit covers UTM taxonomy, event tracking validation, CRM tagging, and dashboard architecture. You walk away knowing exactly what’s broken and what to fix first.
Get your measurement audit at Rule27design and move from traffic reporting to pipeline attribution within a month.
Sources
Short list of the most useful references for teams building or improving a content measurement program:
- How to measure content marketing performance | Scoop Analytics
- How to Align KPIs to Strategy: The Framework That Connects Daily Work to Organizational Mission | ClearPoint Strategy
- Content marketing ROI statistics | Revenue Memo
- Content marketing metrics: the practitioner’s measurement framework | The Seo Engine
Topics

About the Author
Josh AndersonCo-Founder & CEO at Rule27 Design
Operations leader and full-stack developer with 15 years of experience disrupting traditional business models. I don't just strategize, I build. From architecting operational transformations to coding the platforms that enable them, I deliver end-to-end solutions that drive real impact. My rare combination of technical expertise and strategic vision allows me to identify inefficiencies, design streamlined processes, and personally develop the technology that brings innovation to life.
View Profile

