
Discover how business intelligence for e-commerce brands in 2026 can boost conversions, optimize marketing, and drive smarter decisions.
TL;DR:
- Business intelligence for e-commerce involves analyzing sales, customer, and marketing data to support quick, evidence-based decisions.
- Implementing privacy-compliant, server-side tracking, a semantic layer, and focused dashboards ensures accurate, consistent insights.
- Focusing on five core KPIs and aligning review cadence with metric speed enables brands to turn data into actionable strategies.
Business intelligence for e-commerce brands is the practice of collecting, analyzing, and acting on data across sales, customer behavior, marketing, and operations to make faster, smarter decisions. The industry term is ecommerce BI, and it covers everything from Google Analytics 4 event tracking to semantic layers that keep your revenue numbers consistent across every dashboard your team touches. If you’re running a Shopify store or managing a multi-channel retail operation, BI is not a luxury add-on. It’s the system that tells you why your conversion rate dropped on Tuesday, which customer segment drives 80% of your lifetime value, and where your ad spend is actually going. This guide covers the KPIs that matter, the data infrastructure you need in 2026, and how to build dashboards your team will actually use.
What is business intelligence for e-commerce brands?
Ecommerce BI is defined as the technologies and practices that turn raw store data into decisions. That includes e-commerce analytics tools like Google Analytics 4, Shopify Analytics, and platforms like Looker or Power BI that sit on top of your data warehouse. The core purpose is simple: replace gut-feel decisions with evidence. BI advantages for growth are well documented, and for e-commerce specifically, the payoff shows up in conversion rate lifts, lower customer acquisition costs, and better inventory planning.

The data sources feeding ecommerce BI typically include your storefront (Shopify, WooCommerce, BigCommerce), ad platforms (Meta, Google Ads, TikTok), email tools (Klaviyo, Mailchimp), and your CRM. Pulling these together into a single view is the first real challenge. Without a unified layer, your marketing team sees one revenue number in Google Ads, your ops team sees another in Shopify, and nobody agrees on what actually happened last month.
What KPIs should e-commerce brands track in their BI dashboards?
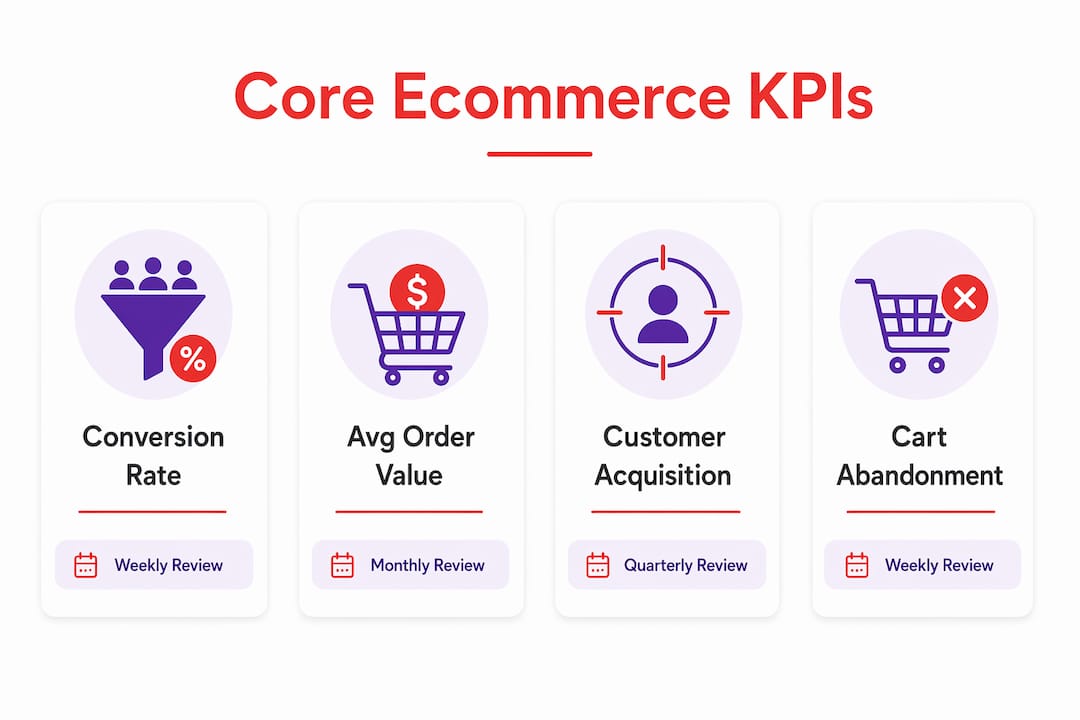
Shopify recommends starting with five core KPIs before adding complexity: conversion rate, average order value (AOV), customer acquisition cost (CAC), customer lifetime value (CLV), and cart abandonment rate. That’s solid advice. Each of these metrics maps directly to a business lever you can pull.
Here’s what each one tells you and why it belongs in your core set:
- Conversion rate measures the percentage of sessions that result in a purchase. A drop here signals friction in your funnel, not just low traffic.
- Average order value tracks how much each buyer spends per transaction. Increasing AOV by 10% through bundles or upsells costs nothing in acquisition spend.
- Customer acquisition cost divides total marketing spend by new customers acquired. Rising CAC is an early warning sign that your paid channels are getting less efficient.
- Customer lifetime value predicts total revenue from a customer over their relationship with your brand. High CLV justifies higher CAC and informs retention investment.
- Cart abandonment rate shows the percentage of initiated checkouts that never complete. Industry averages sit above 70%, so even small improvements here move real revenue.
Pro Tip: Segment each KPI by acquisition channel from day one. A customer acquired through organic search often has a 20 to 30% higher CLV than one acquired through paid social. If you blend these numbers, you’ll misallocate budget.
Review cadence matters as much as KPI selection. Effective review timing means checking leading indicators like sessions and add-to-cart rates daily, conversion metrics weekly, and retention and CLV data monthly or quarterly. Daily reviews of lagging metrics create noise, not insight.
| KPI | Review cadence | Primary decision it drives |
|---|---|---|
| Conversion rate | Weekly | Funnel optimization, UX changes |
| Average order value | Weekly | Bundling, upsell strategy |
| Customer acquisition cost | Weekly | Ad spend allocation |
| Customer lifetime value | Monthly/Quarterly | Retention investment, channel mix |
| Cart abandonment rate | Weekly | Checkout flow improvements |
How do you collect quality e-commerce data under 2026 privacy rules?
Cookie-based tracking is no longer reliable. Server-to-server tracking achieves near-100% conversion visibility compared to 50 to 70% for cookie-based methods. That gap is the difference between accurate BI and decisions built on incomplete data.
Here’s how to build a privacy-compliant data collection setup that holds up in 2026:
- Move to server-side event collection. First-party data stacks send events from your server environment rather than the browser. This bypasses ad blockers and cookie restrictions while keeping conversion data intact.
- Integrate a consent management platform (CMP). Tools like OneTrust or Cookiebot handle GDPR and CCPA consent flows. Your CMP should connect directly to your tag manager so that events only fire when consent is granted.
- Audit your GA4 ecommerce events. The core GA4 events for ecommerce are "view_item
,add_to_cart,begin_checkout, andpurchase. Each requires consistent parameters. Inconsistenttransaction_id` values are the most common cause of duplicate purchase events, which corrupt your revenue KPIs. - Run parallel validation. Compare GA4 purchase counts against Shopify order counts weekly. A variance above 5% signals a tracking problem worth investigating before it compounds.
Pro Tip: Don’t wait until your privacy audit to fix server-side tracking. Retrofitting attribution infrastructure after a GDPR enforcement action is significantly harder than building it right the first time. Fixing attribution later under active privacy constraints risks months of degraded KPI data.
The digital transformation benefits for retail brands that invest in first-party data infrastructure go beyond compliance. You get cleaner data, more accurate attribution, and a competitive edge as third-party signals continue to erode.
What are the attribution modeling challenges in e-commerce BI?
Attribution modeling is where most ecommerce BI setups quietly fall apart. GA4 uses different attribution models depending on what you’re measuring: last-click for sessions, first-click for users, and data-driven for key events. If your dashboard pulls from all three without alignment, you end up chasing metrics that contradict each other.
This is what practitioners call “ghost chasing.” Your paid social team sees strong ROAS in Meta Ads Manager. Your GA4 report shows the same channel contributing half that revenue. Neither number is wrong. They’re just measuring different things with different attribution windows. Without a governance layer, your team wastes hours reconciling reports instead of making decisions.
| Attribution model | What it credits | Best used for |
|---|---|---|
| Last-click | Final touchpoint before purchase | Direct response campaigns |
| First-click | First touchpoint in the journey | Brand awareness measurement |
| Data-driven | Distributes credit by ML model | Full-funnel optimization |
| Linear | Equal credit across all touchpoints | Understanding full customer journey |
The solution is a semantic layer. A semantic layer sits between your raw data sources and your BI tools, enforcing a single definition of revenue, funnel metrics, and time windows across every report. When Looker, Power BI, and your custom dashboard all query the same semantic layer, they return the same number. That’s not a small thing. Metric consistency without semantic layer enforcement leads to reconciliation battles that erode trust in your data and slow down every decision.
“A semantic layer doesn’t just clean up your dashboards. It changes the culture. When everyone agrees on what ‘revenue’ means, you stop arguing about the data and start acting on it.”
How should e-commerce brands design dashboards that drive decisions?
Dashboards that work as decision systems show only the KPIs that lead to clear actions. The most common mistake is building a dashboard that displays everything you can measure instead of everything you should act on. Forty metrics on one screen is a reporting trophy, not a decision tool.
A layered dashboard architecture works best for most e-commerce teams:
- Executive view: Revenue, CLV, CAC, and gross margin. Updated daily. No more than six metrics. This is the pulse check.
- Operational view: Conversion rate by channel, cart abandonment by device, AOV by product category. Updated daily. This is where your marketing and merchandising teams live.
- Strategic view: Cohort retention, CLV by acquisition channel, repeat purchase rate. Updated monthly. This drives budget allocation and product decisions.
Segmentation is where dashboards go from useful to genuinely powerful. Break conversion rate by device type and you’ll often find mobile converts at half the rate of desktop, which points directly to a UX problem worth fixing. Break AOV by traffic source and you’ll find which channels bring buyers versus browsers. Custom dashboards built around your specific product catalog and channel mix outperform generic out-of-the-box reports every time.
Pro Tip: Add a “so what” column to every dashboard you build. Next to each KPI, include a cell that shows the recommended action when the metric crosses a threshold. Conversion rate drops below 2%? The cell reads “Review checkout flow and run A/B test.” This turns passive reporting into active decision-making.
Review your marketing metrics at the right frequency for each layer. Daily reviews of strategic metrics create anxiety without insight. Monthly reviews of operational metrics mean you’re always reacting too late.
Key takeaways
Ecommerce BI works when you combine a focused KPI set, privacy-compliant data infrastructure, consistent attribution governance, and dashboards designed for decisions rather than display.
| Point | Details |
|---|---|
| Start with five core KPIs | Conversion rate, AOV, CAC, CLV, and cart abandonment cover the most critical business levers. |
| Move to server-side tracking | Cookie-based methods capture only 50 to 70% of conversions; server-side achieves near-100% visibility. |
| Adopt a semantic layer | Consistent metric definitions across BI tools eliminate reconciliation battles and build data trust. |
| Match review cadence to metric speed | Daily for leading indicators, weekly for funnels, monthly for retention and strategy. |
| Design dashboards for action | Layer executive, operational, and strategic views and limit each to the KPIs that drive clear decisions. |
What I’ve learned building BI systems for e-commerce brands
The biggest shift I’ve seen in ecommerce BI isn’t technical. It’s cultural. Most teams I work with start out treating their dashboards as reporting artifacts. Something you look at after the month closes to explain what happened. The brands that grow fastest treat their dashboards as operating systems. Something you check before you make a decision.
The KPI selection conversation is where this mindset shift becomes real. Every team wants to track everything. I’ve sat in rooms where someone argues passionately for tracking 40 metrics “just to have visibility.” What they actually get is paralysis. When everything is a priority, nothing is. Shopify’s recommendation to start with five KPIs isn’t a limitation. It’s a forcing function that makes you decide what actually matters to your business right now.
The semantic layer conversation is harder to have because it feels abstract until the moment your CFO and your CMO are looking at two different revenue numbers in the same meeting. I’ve watched that moment happen. It destroys trust in the entire BI program, sometimes permanently. Building the governance layer early, before you have a metric crisis, is one of the highest-leverage investments a growth-stage e-commerce brand can make.
One more thing: don’t let perfect be the enemy of useful. A simple, well-maintained dashboard with five reliable KPIs beats a sophisticated BI setup with data quality problems every time. Start clean, stay clean, and add complexity only when your team has outgrown the current setup.
— Josh
Ready to build a BI system that actually works?
Rule27design built the Innovation Lab specifically for e-commerce brands that are ready to move beyond spreadsheets and disconnected analytics tools. The team designs custom dashboards, advises on BI architecture, and integrates modern data stacks that scale with your catalog and team.
If your current setup has metric inconsistencies, attribution gaps, or dashboards nobody checks, that’s a solvable problem. Rule27design works with growth-stage brands that have outgrown basic tools but don’t need enterprise-level complexity. The Innovation Lab is the right starting point. Explore what’s possible and book a consultation to see how a purpose-built BI system can change how your team makes decisions.
FAQ
What is business intelligence for e-commerce brands?
Business intelligence for e-commerce brands is the practice of collecting and analyzing data across sales, customer behavior, marketing, and operations to support faster, more accurate decisions. It uses tools like Google Analytics 4, Shopify Analytics, and BI platforms like Looker or Power BI to turn raw store data into performance insights.
What are the most important KPIs for ecommerce BI?
Conversion rate, average order value, customer acquisition cost, customer lifetime value, and cart abandonment rate are the five KPIs Shopify recommends as a starting point for ecommerce BI dashboards. Each maps to a specific business lever and should be reviewed at a cadence matched to how quickly the metric changes.
How does server-side tracking improve ecommerce data quality?
Server-side tracking sends conversion events from your server rather than the browser, bypassing ad blockers and cookie restrictions. This method achieves near-100% conversion visibility compared to 50 to 70% for traditional cookie-based tracking, which means your revenue KPIs reflect what actually happened.
What is a semantic layer and why does ecommerce BI need one?
A semantic layer is a governed translation layer that enforces consistent metric definitions across all BI tools and dashboards. Without one, different platforms produce different revenue numbers from the same data, which leads to reconciliation conflicts and erodes team trust in the entire BI program.
How often should e-commerce brands review their BI dashboards?
Leading indicators like sessions and add-to-cart rates should be reviewed daily, conversion metrics weekly, and retention and CLV data monthly or quarterly. Matching review frequency to metric speed prevents noise from daily fluctuations in lagging metrics and keeps decisions grounded in meaningful trends.

About the Author
Josh AndersonCo-Founder & CEO at Rule27 Design
Operations leader and full-stack developer with 15 years of experience disrupting traditional business models. I don't just strategize, I build. From architecting operational transformations to coding the platforms that enable them, I deliver end-to-end solutions that drive real impact. My rare combination of technical expertise and strategic vision allows me to identify inefficiencies, design streamlined processes, and personally develop the technology that brings innovation to life.
View Profile

