

Discover what is usage analytics and how it helps growth-stage teams boost retention and reduce churn by understanding user behavior.
TL;DR:
- Usage analytics measures in-product user behavior to improve retention and guide product decisions. It provides real-time insights into feature adoption, engagement, and retention that inform growth strategies. Proper implementation ensures trustworthy data that helps teams make impactful, outcome-driven choices.
Usage analytics is defined as the systematic practice of measuring in-product user behavior, including clicks, feature adoption, and session duration, to identify what drives retention and what causes churn. The industry term for this practice is “product usage analytics,” and it sits at the intersection of behavioral data and business strategy. Unlike marketing analytics, which tracks how users arrive at your product, usage analytics tracks what they do once they’re inside it. For business analysts and decision-makers at growth-stage companies, this distinction matters enormously. You can spend heavily on acquisition and still lose users because you never understood how they actually used your product. Usage analytics closes that gap.
What is usage analytics and why does it matter?
Usage analytics maps behavior like activation rate, time-to-value, and feature adoption patterns that marketing analytics never captures. That means you get answers to questions like: which features do users actually return for, and which ones do they ignore after the first week?

The importance of usage analytics becomes clear when you consider what it replaces. Without it, product decisions rely on user surveys, support tickets, and gut instinct. All three are slow and biased. Usage data analysis gives you a continuous, unfiltered record of real behavior.
For growth-stage companies specifically, this matters because your product is still evolving. Every sprint cycle, you’re making bets on what to build next. Usage analytics tells you which bets are paying off and which features are collecting dust.
Pro Tip: Start measuring usage analytics before you think you need it. Retroactive data collection is impossible, and the patterns you miss in months 1–6 are often the most revealing.
What core metrics define effective usage analytics?
Effective usage reports focus on four pillars: acquisition, engagement, conversions, and retention. Each one answers a different question about your product’s health.
- Acquisition tracks where users come from and which sources produce users who actually stick around. Not all acquisition channels deliver the same quality of user.
- Engagement covers session length, feature clicks, and workflow completion. An engaged session is industry-defined as lasting more than 10 seconds, involving multiple page views, or including a conversion event. That definition matters because it separates meaningful visits from accidental ones.
- Conversions are the specific events tied to your business goals. For a SaaS product, that might be a user completing onboarding, upgrading a plan, or inviting a teammate.
- Retention indicators show whether users return after their first session and whether they build habits around your product. Retention is the metric that predicts long-term revenue more reliably than any other.
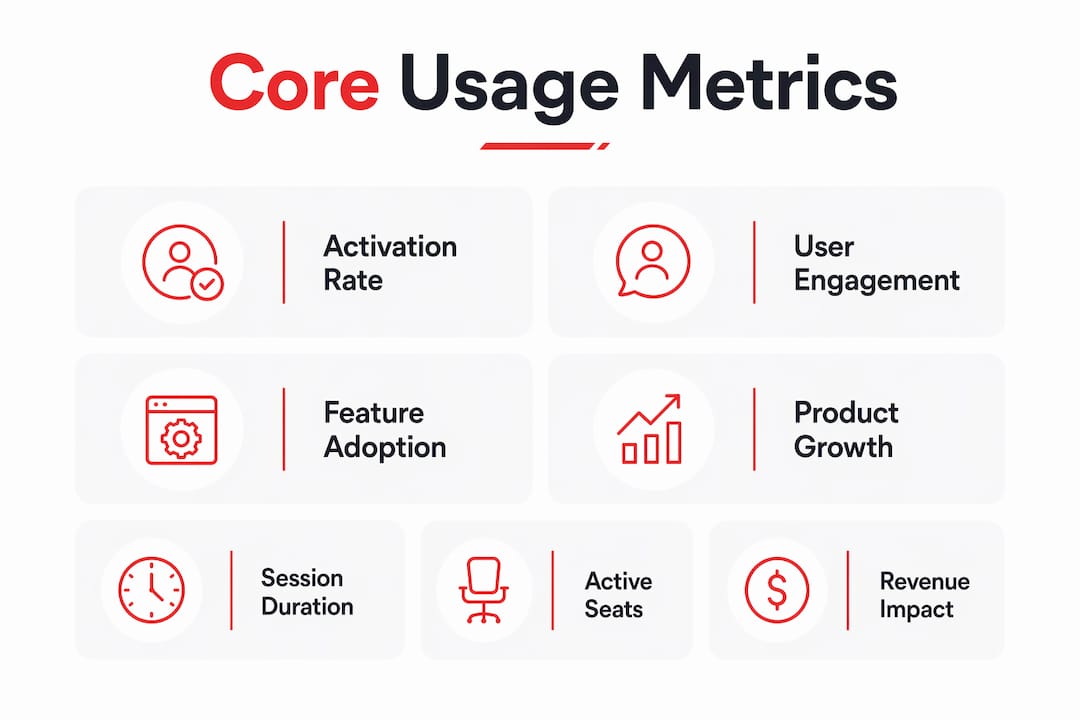
What are usage metrics worth tracking? Only the ones tied to outcomes. Counting total logins is a common misconception. A user who logs in daily but never completes a core workflow is not an engaged user. Tie every metric to a business outcome or drop it from your dashboard.
Pro Tip: Build your metrics list by working backward from your revenue model. If you charge per seat, track active seats. If you charge per usage event, track event frequency. Vanity metrics feel good but don’t predict growth.
How does usage analytics differ from user analytics?
Usage analytics addresses what users do; user analytics addresses who they are. Both are useful, but they answer different questions and require different tools.
| Dimension | Usage analytics | User analytics |
|---|---|---|
| Definition | Measures in-product behavioral patterns | Profiles individual users and segments |
| Focus | Feature adoption, session flow, retention | Demographics, firmographics, user attributes |
| Techniques | Event tracking, funnel analysis, cohort analysis | Segmentation, persona modeling, CRM data |
| Goals | Optimize product design and retention | Personalize experience and target messaging |
Marketing analytics adds a third layer. It focuses on acquisition channels, ad performance, and site traffic before a user ever touches your product. Web analytics tools track page views and bounce rates, which are useful for content teams but tell you nothing about in-product behavior.
The practical takeaway: usage analytics and user analytics serve distinct but complementary roles. Used together, they give you a complete picture. Used in isolation, each one leaves a blind spot. A data-driven content strategy for your product requires both layers working in sync.
What are the best practices for implementing usage analytics in 2026?
Implementation quality determines whether your usage data is trustworthy or misleading. Follow these steps to build a reliable foundation.
- Set up your account and property correctly. Create a dedicated analytics property for your product, separate from your marketing site. Mixing product data with website data produces noise that corrupts both.
- Deploy tracking tags with a consistent naming convention. Event names like
feature_clickedandonboarding_completedare readable and sortable. Inconsistent naming, like mixing snake_case with camelCase, creates reporting gaps that take weeks to untangle. - Configure data streams with filters. Exclude internal traffic from your team’s IP addresses immediately. Internal activity inflates engagement numbers and distorts retention curves.
- Enable enhanced measurement. Automatic event tracking captures scroll depth, file downloads, and outbound clicks without custom code. It’s a fast way to get baseline data while your engineering team builds custom events.
- Extend your data retention window. Default retention settings in most platforms are too short for meaningful year-over-year analysis. Extending data retention to at least 14 months lets you compare cohorts across full annual cycles.
- Establish data governance from day one. Consistent event naming, documented tracking plans, and clear ownership of the analytics stack prevent the data debt that kills insight quality at scale.
Stale data and misinterpretation reduce insight usefulness when metrics aren’t tied to business value. The most common pitfall is measuring activity instead of engagement. A user who opens your app and immediately closes it counts as a session. That session is not evidence of engagement.
Pro Tip: Document every event you track in a shared spreadsheet before you deploy it. Include the event name, trigger condition, and the business question it answers. This single habit prevents months of confusion later.
How can analysts use usage data to optimize products and grow engagement?
Usage analytics reveals how users move through a product, highlighting adoption patterns, friction points, and workflow shortcuts. The question is how to turn that data into decisions.
- Cohort analysis groups users by the week or month they first activated and tracks their retention over time. This tells you whether product changes are actually improving retention or just masking churn with new signups. Segmentation by behavior attributes like region and plan type lets you tailor decisions to specific user groups rather than averaging across everyone.
- Funnel analysis shows where users drop off in a defined workflow. If 80% of users start onboarding but only 40% complete it, the drop-off point is your highest-priority fix. No amount of feature development compensates for a broken onboarding flow.
- Feature adoption tracking identifies your power users and your at-risk users simultaneously. Power users show you what your product does best. At-risk users show you where it fails to deliver value fast enough.
- Self-serve exploratory analysis accelerates the feedback loop between data and decisions. Self-serve tools empower product managers and analysts to independently track user journeys without waiting for a data team to run queries. That speed matters when you’re shipping weekly.
Analytics in marketing and product contexts drives measurably better ROI when behavioral data informs both acquisition targeting and product prioritization together. The companies that win are the ones that close the loop between what marketing promises and what the product delivers.
Usage data also informs pricing strategy. If your highest-retention users consistently use one specific feature, that feature belongs at the center of your pricing model, not buried in an enterprise tier. Real usage data makes that argument in a way that opinion never can.
What trends are shaping usage analytics in 2026 and beyond?
AI and machine learning are changing how teams interpret usage data. Predictive models now flag at-risk users before they churn, based on behavioral signals that human analysts would miss in a manual review. That shift moves usage analytics from descriptive to predictive.
Privacy-aware data governance is no longer optional. Regulations around user data collection have tightened globally, and analytics implementations that ignore consent management create legal and reputational risk. The best implementations build privacy controls into the tracking architecture from the start, not as an afterthought.
Usage analytics is also expanding beyond SaaS. Connected hardware, mobile apps, and enterprise internal tools all generate behavioral data that follows the same analytical frameworks. Business analysts driving SaaS results today are building skills that transfer directly to these adjacent domains.
Cross-functional analytics is the final shift worth watching. When product, marketing, and customer success teams share a single usage data layer, decisions align faster. Siloed analytics creates siloed strategy. Shared data creates shared accountability.
Key Takeaways
Usage analytics is the most direct path from raw behavioral data to product decisions that actually improve retention and revenue.
| Point | Details |
|---|---|
| Define usage analytics clearly | It measures in-product behavior like feature adoption and session flow, not site traffic or ad performance. |
| Prioritize outcome-tied metrics | Track activation rate, feature adoption, and retention. Drop vanity metrics like total logins. |
| Implement with governance first | Consistent event naming and extended data retention windows are non-negotiable from day one. |
| Use cohort and funnel analysis | These two techniques reveal retention patterns and drop-off points that aggregate data hides. |
| Combine usage and user analytics | Usage data tells you what users do; user analytics tells you who they are. Both together drive better decisions. |
Why most teams are measuring the wrong things
Here’s what I’ve seen over and over with growth-stage teams: they instrument everything they can track, then wonder why their dashboards don’t help them make decisions. The problem isn’t the data. It’s the question they started with.
Most teams start with “what can we measure?” The right question is “what decision are we trying to make?” When you start there, your event taxonomy gets smaller and sharper. You stop tracking every click and start tracking the clicks that predict whether a user will still be paying you in 90 days.
The other thing I’d push back on is the idea that more data equals more insight. I’ve watched teams spend months building elaborate analytics stacks and still make product decisions based on the loudest customer complaint. Customer retention strategies built on behavioral data outperform those built on anecdote, but only if the team actually trusts the data enough to act on it.
Building that trust takes time and discipline. It means documenting your tracking plan, auditing your events quarterly, and being honest when a metric is broken. The teams that do this consistently are the ones that actually use their dashboards. Everyone else just looks at them.
— Josh
Rule27design builds the analytics infrastructure your team will actually use
Growth-stage companies often have the data. What they’re missing is a system that makes it accessible to the people who need it.

Rule27design builds custom analytics dashboards and internal tools that connect your usage data to the decisions your product and business teams make every day. No bloated enterprise software. No off-the-shelf tool that almost fits. Just a system designed around how your team actually works, with the business intelligence layer built in from the start. If your current setup produces data that nobody acts on, that’s the problem worth solving.
FAQ
What is the usage analytics definition in simple terms?
Usage analytics is the practice of tracking and analyzing how users interact with a product to understand what drives engagement and retention. It focuses on in-product behavior like feature clicks, session length, and workflow completion.
What are usage metrics, and which ones matter most?
Usage metrics are quantitative measures of in-product behavior, including activation rate, feature adoption, session duration, and retention rate. The ones that matter most are those tied directly to your business outcomes, not aggregate activity counts.
How does usage data analysis differ from web analytics?
Web analytics tracks site traffic, page views, and acquisition channels before a user enters your product. Usage data analysis tracks what users do inside the product, making it the more relevant signal for product and retention decisions.
What are the benefits of usage analytics for growth-stage companies?
Usage analytics gives growth-stage teams a continuous, unbiased record of real user behavior, enabling faster product decisions, better feature prioritization, and earlier detection of churn risk.
How do you start implementing usage analytics correctly?
Start by defining the business questions you need to answer, then build a tracking plan with consistent event names, exclude internal traffic, and extend your data retention window to at least 14 months for meaningful trend analysis.

About the Author
Josh AndersonCo-Founder & CEO at Rule27 Design
Operations leader and full-stack developer with 15 years of experience disrupting traditional business models. I don't just strategize, I build. From architecting operational transformations to coding the platforms that enable them, I deliver end-to-end solutions that drive real impact. My rare combination of technical expertise and strategic vision allows me to identify inefficiencies, design streamlined processes, and personally develop the technology that brings innovation to life.
View Profile

