
Transform SaaS analytics into action with this step-by-step guide. Achieve 40%+ efficiency gains, boost content visibility 35%, and accelerate decisions by 50% through custom dashboards.
Growth-stage SaaS companies waste countless hours deciphering analytics dashboards that offer data without direction. You’ve invested in tracking tools, yet your team still struggles to make confident decisions quickly. The problem isn’t lack of data; it’s the absence of actionable insights tailored to your workflows. This guide walks you through building custom analytics solutions that deliver measurable results, transforming raw numbers into strategic advantages that boost efficiency and content performance.
Key Takeaways
| Point | Details |
|---|---|
| Prerequisites Matter | Clean centralized data, team analytics literacy, clear business goals, and compatible tech stack are essential before starting. |
| Phased Implementation Wins | Deploy analytics in focused stages with targeted training to ensure 70% higher adoption rates and reduce resistance. |
| Avoid Common Pitfalls | Limit dashboard KPIs, establish data governance early, and prioritize mobile accessibility to prevent cognitive overload. |
| Measurable ROI Expected | Anticipate 40%+ operational efficiency gains, 35% content visibility increase, and 50% faster decision making within months. |
| Continuous Optimization Required | Monitor usage metrics and iterate dashboards based on real user feedback to sustain long-term value. |
Introduction to Actionable Analytics in SaaS
Actionable analytics transforms data into specific, timely recommendations that drive immediate business decisions. Unlike generic dashboards that display metrics without context, actionable analytics tells you exactly what to do next. For growth-stage SaaS companies, this means insights automatically surface when content performance dips, workflows bottleneck, or customer behavior shifts.
Generic off-the-shelf analytics tools fail SaaS teams because they weren’t designed for your unique workflows. Your content strategy, customer lifecycle, and operational processes differ fundamentally from e-commerce or manufacturing businesses. When analytics don’t align with how your team actually works, adoption plummets. Studies show teams ignore up to 60% of available analytics when tools lack relevance to daily tasks.
Custom analytics integrated with SaaS-specific admin systems unlock transformation. You gain:
- Real-time alerts when content engagement drops below threshold
- Automated workflow bottleneck identification with recommended fixes
- Predictive insights on customer churn before it happens
- Role-based dashboards showing only metrics each team member can act on
- Integration with existing tools your team already uses daily
The difference between data and action becomes clear when workflow efficiency in SaaS operations improves measurably. Teams spend less time hunting for answers and more time executing strategic initiatives. Companies implementing tailored analytics report 40% efficiency gains through analytics within the first year, with content teams particularly benefiting from visibility into performance patterns.
Actionable analytics shifts your SaaS operations from reactive to proactive. Instead of discovering problems weeks after they occur, your systems flag issues immediately with clear remediation steps. This acceleration compounds over time as your team builds confidence in data-driven decision making.
Prerequisites: What You Need Before Starting
Successful analytics implementation requires foundational elements in place before you build custom dashboards. Skipping prerequisites leads to abandoned systems and wasted investment. Assess your readiness across these critical areas.
You need centralized, clean data flowing from all key systems. Siloed databases scattered across departments create conflicting metrics that erode trust. Consolidate customer data, content performance metrics, operational workflows, and financial information into unified storage. Data quality matters more than quantity; inaccurate information produces misleading insights that damage decision confidence.

Your team requires basic analytics literacy to interpret and act on insights. This doesn’t mean everyone needs statistics degrees, but stakeholders should understand fundamental concepts like correlation versus causation, statistical significance, and trend analysis. Without this foundation, even the most sophisticated dashboards sit unused. Invest in team analytics literacy training before deploying tools.
Clear business goals provide the North Star for analytics design. What specific outcomes do you want to improve? Vague objectives like “better performance” won’t guide effective dashboard creation. Define measurable targets: reduce customer onboarding time by 25%, increase content conversion rates by 15%, or decrease support ticket resolution time by 30%. These concrete goals determine which metrics deserve dashboard prominence.
Your tech stack must support integration without extensive custom development. Modern SaaS platforms typically offer APIs, but legacy systems may require middleware or data pipelines. Evaluate whether your current infrastructure can feed real-time data to analytics tools. Incompatible systems force manual data entry that defeats automation benefits.
Pro Tip: Conduct a tech stack compatibility audit before committing to analytics platforms. Map all data sources, integration points, and potential bottlenecks. This assessment prevents costly mid-implementation pivots when you discover critical systems can’t connect.
Content governance and data quality frameworks ensure ongoing accuracy. Establish ownership for each data domain, validation rules, and update cadences. Without governance, data degrades over time as team members input information inconsistently or systems fall out of sync.
Step-by-Step Implementation Process
Building actionable analytics requires deliberate phases that balance ambition with adoption reality. Rushing deployment overwhelms users while moving too slowly allows enthusiasm to fade. Follow this proven sequence.
-
Prepare and validate your data foundation. Audit existing data sources for accuracy, completeness, and consistency. Clean duplicate records, standardize naming conventions, and fill critical gaps. Establish automated validation rules that flag anomalies before they corrupt insights. This unglamorous work determines everything that follows; flawed data produces flawed recommendations regardless of dashboard sophistication.
-
Design role-specific dashboards matching actual workflows. Generic one-size-fits-all dashboards confuse more than clarify. Content managers need different metrics than operations leads or customer success teams. Map each role’s daily decisions and surface only actionable metrics for those choices. Use custom dashboard design principles that prioritize clarity over comprehensiveness. Include contextual benchmarks so users immediately recognize whether performance is strong or needs attention.
-
Deploy in focused phases with targeted training. Resist the urge to launch everything simultaneously. Start with one team or department, perfect the system based on feedback, then expand. Each phase should include hands-on training where team members practice interpreting insights and making decisions. Generic tutorial videos don’t build confidence like guided practice sessions. Phased rollout and training approaches achieve 70% higher sustained adoption than big-bang launches.
-
Monitor usage patterns and iterate continuously. Track which dashboards get opened, which metrics drive action, and where users struggle. Analytics about your analytics reveal adoption barriers and unused features. Schedule monthly review sessions where users share what works and what confuses them. Implement refinements quickly to demonstrate responsiveness. This feedback loop prevents tools from becoming static monuments that lose relevance as business needs evolve.
Pro Tip: Build iterative feedback loops into your deployment calendar from day one. Monthly check-ins with actual users surface friction points before they become adoption killers. Small refinements based on real usage patterns dramatically improve long-term value.
The table below shows typical implementation phases and activities:
| Phase | Duration | Key Activities | Success Metric |
|---|---|---|---|
| Foundation | 2-3 weeks | Data audit, cleanup, governance setup | 95%+ data accuracy rate |
| Design | 3-4 weeks | User interviews, dashboard prototyping, feedback cycles | 80%+ user approval in testing |
| Pilot Launch | 4-6 weeks | Single team deployment, intensive training, daily support | 60%+ daily active usage |
| Full Rollout | 8-12 weeks | Company-wide expansion, documentation, ongoing optimization | 70%+ sustained adoption |
Integrating content performance optimization capabilities during design ensures marketing and content teams gain immediate value from analytics deployment.
Common Mistakes and Troubleshooting Tips
Even well-planned implementations hit predictable obstacles. Recognize these patterns early and apply proven fixes before small issues compound into project failures.
Ignoring data governance creates chaos as your system scales. Without clear ownership, nobody takes responsibility when metrics conflict or data quality degrades. Establish data governance best practices including designated data stewards for each domain, validation protocols, and regular quality audits. Poor governance causes 40% of analytics initiatives to lose credibility within the first year.
Overloading dashboards with too many KPIs paralyzes decision making instead of enabling it. When users face 30 metrics per screen, cognitive load prevents pattern recognition. Limit each dashboard to 5-8 primary metrics that directly inform specific actions. Use drill-down capabilities for supporting details rather than cluttering the main view. User-friendly dashboard design principles emphasize ruthless prioritization.
Neglecting mobile accessibility limits analytics value for distributed teams and on-the-go leaders. If dashboards only work on desktop browsers, adoption suffers among field teams, remote workers, and executives who make decisions between meetings. Design responsive interfaces that surface critical insights on any device. Mobile-first analytics increases usage frequency by 45% compared to desktop-only systems.
Skimping on comprehensive training assumes dashboards are self-explanatory. They never are. Users need guidance interpreting metrics, understanding context, and translating insights into actions. Invest in role-specific training that walks through real scenarios and decision frameworks. Provide job aids and quick reference guides accessible within the dashboard itself.
Common mistakes and fixes:
- Mistake: Launching without user testing. Fix: Run prototype sessions with actual end users before full deployment.
- Mistake: Static dashboards that never evolve. Fix: Schedule quarterly reviews and updates based on changing business needs.
- Mistake: Metrics without context or benchmarks. Fix: Always show current performance against targets, historical trends, or peer comparisons.
- Mistake: No clear action pathways from insights. Fix: Link each metric to specific recommended actions or workflow triggers.
Expected Outcomes and Success Metrics
Quantifying analytics ROI validates investment and guides continuous improvement. Track these metrics to measure transformation and identify optimization opportunities.
Operational efficiency gains manifest quickly when teams act on relevant insights. Companies implementing custom analytics report 40%+ operational efficiency improvements within six months. You’ll see fewer hours spent in status meetings as dashboards answer routine questions automatically. Decision cycles compress when data replaces speculation.
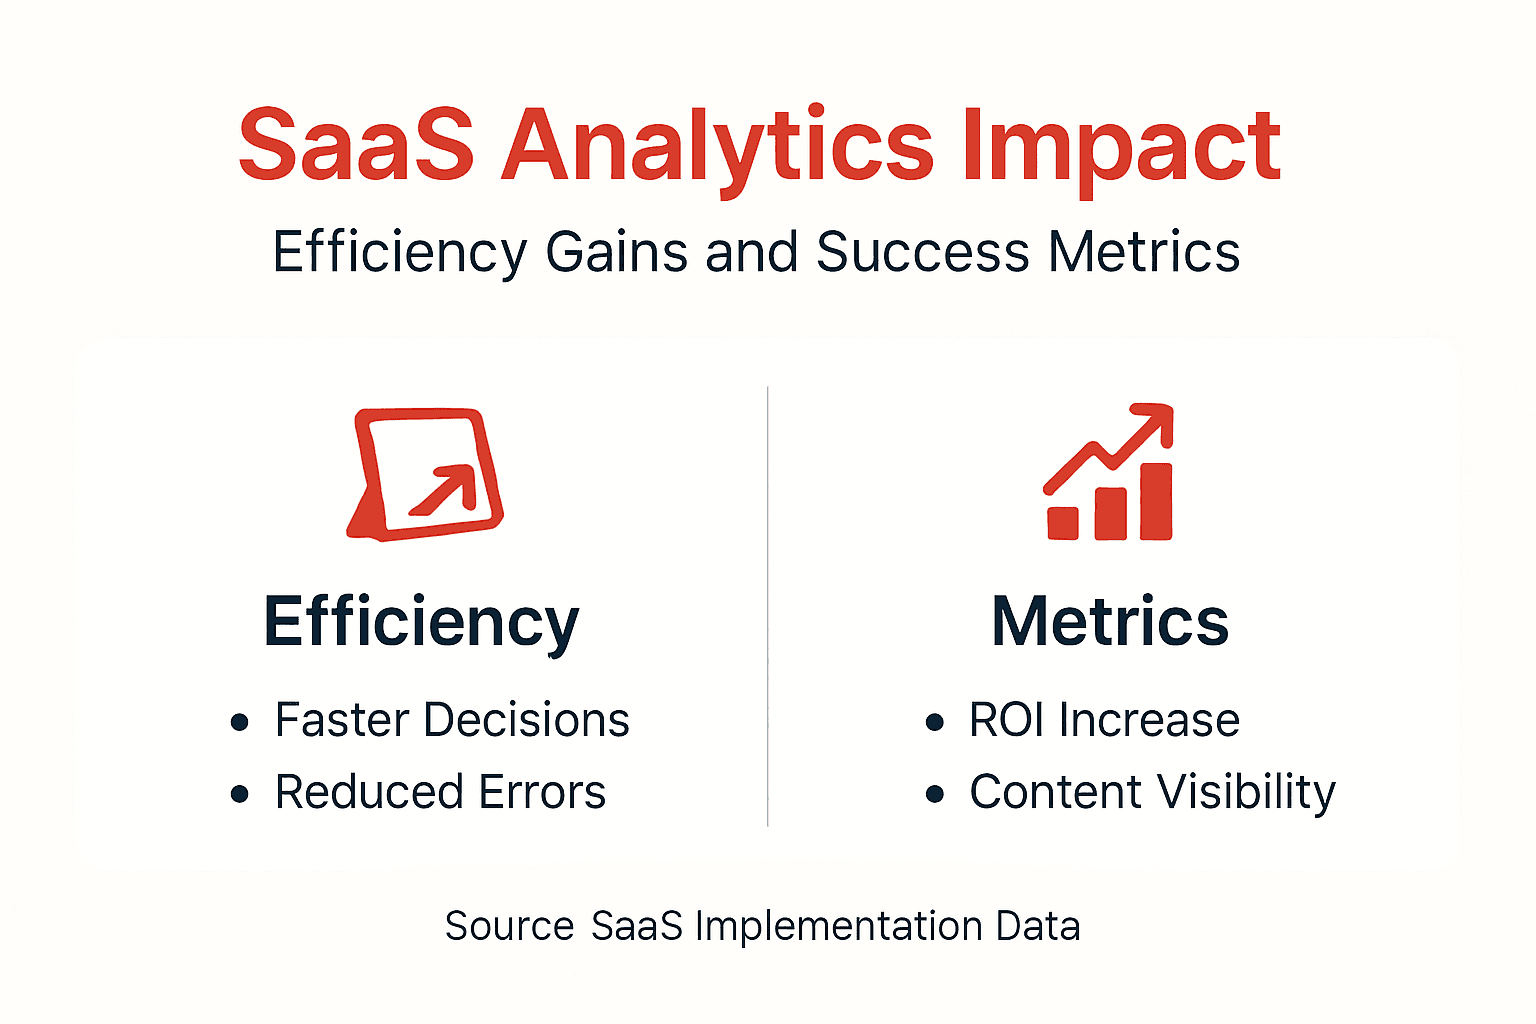
Content visibility increases as analytics reveal performance patterns and optimization opportunities. Teams using integrated content visibility metrics achieve 35% higher search rankings and AI response inclusion. You gain clarity on which topics resonate, which formats drive engagement, and which distribution channels deliver results.
Project success rates climb when teams leverage predictive insights. Analytics that flag risks early allow course corrections before projects derail. Organizations with mature analytics capabilities report 70% higher project success rates compared to peers relying on intuition. You catch scope creep, resource constraints, and timeline issues while remediation remains feasible.
Decision speed accelerates dramatically. Leaders spend 50% less time gathering information and debating options when trusted analytics provide answers. This velocity compounds as faster decisions create more learning cycles and competitive advantages.
The comparison below shows typical before and after results:
| Metric | Before Analytics | After Implementation | Improvement |
|---|---|---|---|
| Time to Decision | 8-12 days average | 3-5 days average | 50%+ faster |
| Operational Efficiency | Baseline | Improved workflows | 40%+ gain |
| Content Visibility | Standard rankings | Optimized performance | 35%+ increase |
| Project Success Rate | 45% on-time, on-budget | 75% on-time, on-budget | 70% improvement |
| Team Confidence in Data | 30% trust metrics | 85% trust metrics | 183% increase |
Continuous monitoring sustains these gains and identifies new opportunities. Schedule monthly metric reviews where stakeholders assess performance against targets and discuss emerging patterns. Analytics excellence isn’t a destination but an ongoing optimization cycle where each insight informs the next improvement.
Mature analytics capabilities become competitive differentiators as your SaaS company scales. The efficiency, visibility, and decision quality advantages compound over time, creating operational moats that competitors struggle to replicate.
Discover Custom Admin Solutions for SaaS Growth
Transforming analytics from overwhelming dashboards into actionable intelligence requires purpose-built systems that match your workflows. Generic tools force your team to adapt to software limitations rather than software adapting to how you actually work.
Rule27 Design specializes in custom admin panels and analytics solutions designed specifically for growth-stage SaaS companies. We build systems that integrate seamlessly with your existing tech stack while delivering the enhanced workflow visibility that drives 40%+ efficiency improvements. Our approach combines clean intuitive admin interfaces with robust backend architecture that scales as your business grows. We don’t just deliver features; we design systems your team actually wants to use daily. Explore how custom solutions bridge the gap between off-the-shelf tools that don’t quite fit and expensive enterprise software that’s overkill.
Frequently Asked Questions
What makes analytics actionable in a SaaS context?
Actionable analytics provides specific, timely recommendations tied directly to business decisions rather than just displaying numbers. For SaaS companies, this means insights automatically trigger workflows, flag risks before they escalate, and surface optimization opportunities matched to each team member’s responsibilities.
How long does a phased implementation typically take?
Phased analytics implementation spans 3-6 months from initial data audit through full company-wide deployment. Foundation and design work requires 5-7 weeks, pilot launch with single team takes 4-6 weeks, and full rollout across departments needs 8-12 weeks including training and optimization.
What is the best way to train staff on new analytics tools?
Role-specific hands-on training sessions where team members practice interpreting real scenarios outperform generic tutorials. Provide job aids accessible within dashboards, schedule monthly review sessions to reinforce concepts, and assign analytics champions within each department to support peers.
How can mobile accessibility improve analytics adoption?
Mobile-optimized dashboards let distributed teams and executives access insights anywhere, increasing usage frequency by 45%. Field teams make data-driven decisions in real-time rather than waiting to return to desks, while leaders review performance between meetings instead of scheduling dedicated analysis time.
What are key signs my SaaS company is ready for actionable analytics?
Readiness indicators include centralized clean data from key systems, team members frustrated by decision delays, clear measurable business goals, and budget allocated for both tools and training. If you’re spending more time debating what the data says than acting on insights, custom analytics will deliver immediate value.
Topics

About the Author
Josh AndersonCo-Founder & CEO at Rule27 Design
Operations leader and full-stack developer with 15 years of experience disrupting traditional business models. I don't just strategize, I build. From architecting operational transformations to coding the platforms that enable them, I deliver end-to-end solutions that drive real impact. My rare combination of technical expertise and strategic vision allows me to identify inefficiencies, design streamlined processes, and personally develop the technology that brings innovation to life.
View Profile

