

Discover why dynamic reporting matters for smarter decisions. Get real-time insights that transform your data into actionable strategies.
TL;DR:
- Dynamic reporting provides real-time, governed insights, enabling faster decisions across organizations. Without a shared semantic model and role-based access, fast dashboards can produce incorrect or inconsistent data. Proper governance, aligned definitions, and matching data refresh rates are key to trust and operational success.
Dynamic reporting is the process of generating interactive, real-time reports that deliver up-to-date, governed insights across an organization. Unlike static snapshots, dynamic reports update automatically, respond to user input, and pull from a unified data layer that keeps every team working from the same numbers. This is why dynamic reporting matters more than ever for data-driven professionals: it cuts the gap between data and decision from days to minutes. Organizations using interactive dashboards see 40%–70% faster insight cycles compared to static reporting. That speed advantage compounds across every team that touches data.
Why dynamic reporting matters more than static reports
Static reports are lagging snapshots. By the time a PDF lands in an inbox, the underlying data has moved. A sales leader reading last Tuesday’s numbers on Friday is making decisions on a week-old picture of the business. Dynamic reporting solves this by connecting reports directly to live or near-live data sources, so the numbers on screen reflect what is actually happening.
The difference shows up most clearly in how teams spend their time. Static reporting creates a cycle of requests, exports, and reconciliation meetings where analysts spend hours confirming that two reports showing different revenue figures are actually measuring the same thing. A governed semantic model eliminates that cycle by defining KPIs like revenue and customer lifetime value in one place. Every report pulls from the same definition, so the debate disappears before it starts.
The benefits of dynamic reporting over static reporting include:
- Real-time data access. Reports reflect current conditions, not last week’s export.
- Self-service exploration. Teams filter, drill down, and slice data without waiting for an analyst.
- Governed definitions. One semantic layer means one version of every metric.
- Faster escalation. Anomalies surface automatically instead of waiting for the next scheduled report.
- Reduced back-and-forth. Interactive dashboards cut the communication overhead that static reports generate.
Only about 20% of non-IT professionals fully meet their own business intelligence needs without guided enablement. Dynamic reporting with proper governance closes that gap by putting trusted, filtered data directly in front of the people who need it.
What makes a dynamic reporting system actually work?
The technology is the easy part. The hard part is governance. A dynamic reporting system built on inconsistent data definitions produces fast, wrong answers. That is worse than a slow, correct static report.

The foundation is a governed semantic model: a single layer that defines every key metric, who can see it, and how it is calculated. Revenue means the same thing in the marketing dashboard as it does in the finance dashboard. Customer lifetime value uses the same formula in every report. This single source of truth is what eliminates reconciliation debates and builds organizational trust in data.
Pro Tip: Before building any dashboard, get cross-functional sign-off on the definition of your top five KPIs. One hour of alignment saves weeks of reconciliation meetings later.
Role-based access is the second pillar. A field sales rep needs different data than a CFO. Gating views by role keeps reports focused and reduces the cognitive load of navigating irrelevant metrics. It also protects sensitive data without locking everyone out of everything.
The third pillar is matching data refresh rates to decision urgency. Not every report needs to update every minute. Operational decisions, like routing a support ticket or adjusting ad spend, may need near-real-time data. Strategic decisions, like quarterly budget allocation, work fine with daily or weekly refreshes. Matching latency to the decision cycle keeps infrastructure costs in check without sacrificing speed where it counts.
Core components of a working dynamic reporting system:
- A governed semantic model with agreed KPI definitions
- Role-gated access for different stakeholder groups
- Automated data ingestion pipelines with quality controls
- Data refresh rates matched to decision urgency
- Self-service exploration tools for non-technical teams
Custom dashboards built for operational efficiency follow exactly this architecture. The goal is not more charts. It is trusted data in the right hands at the right time.
What measurable benefits do organizations gain from dynamic reporting?
The numbers from real implementations are hard to ignore. One organization cut weekly reporting time by 60% after consolidating three analytics tools into a single governed reporting layer. The reporting cycle dropped from two days to under four hours. That is not a marginal improvement. It is a structural change in how the organization operates.
The same implementation saw a 60% reduction in analyst-generated report requests. When teams can answer their own questions through self-service dashboards, they stop submitting tickets to the analytics team. Analysts shift from report production to actual analysis. That reallocation of skilled labor is one of the most underrated benefits of dynamic reporting in business.
Research linking real-time processing maturity to organizational performance shows a correlation coefficient of R² = 0.72. That is a strong relationship. Organizations that integrate real-time data into decision support consistently report higher perceived performance across functions.
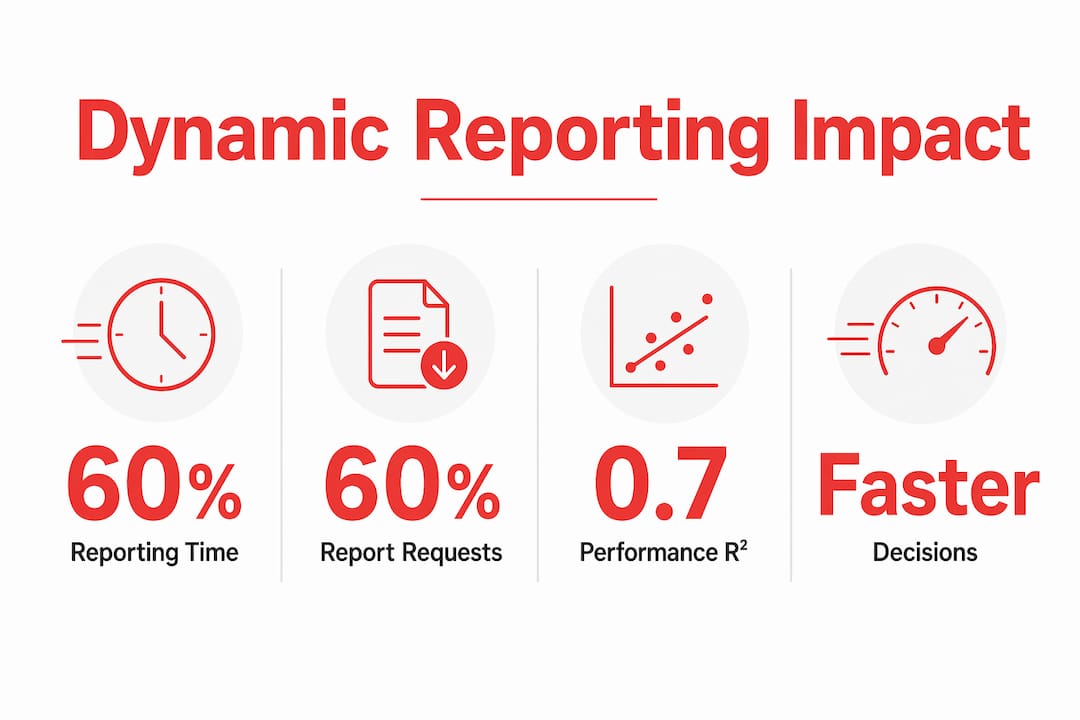
| Benefit | Measured outcome |
|---|---|
| Reporting time reduction | 60% cut, from two days to under four hours |
| Analyst request volume | 60% reduction through self-service enablement |
| Insight cycle speed | 40%–70% faster than static reporting |
| Organizational performance | R² = 0.72 correlation with real-time processing maturity |
The cultural shift matters as much as the numbers. Teams that trust their data make faster decisions with more confidence. They stop hedging in meetings because they know the numbers on screen are current and governed. That confidence compounds over time into a genuine business intelligence advantage that is hard for competitors to replicate quickly.
Analytics-driven marketing teams see similar gains when dynamic reporting connects campaign data to real-time spend decisions. The pattern holds across functions: faster data access, governed definitions, and self-service tools produce measurable performance gains.
When does real-time data actually add value?
Real-time data is not always the right answer. Real-time reporting adds value only when decisions have very short time windows. A fraud detection system needs sub-second data. A monthly budget review does not.
The trap most organizations fall into is investing in real-time streaming infrastructure before automating the upstream processes that feed it. If data collection, reconciliation, and quality checks are still manual, real-time infrastructure just delivers fast and wrong data faster. Automating batch processes and data quality controls produces more freshness improvement than streaming infrastructure alone.
Pro Tip: Map your top ten decisions to their required data freshness before designing any reporting infrastructure. Most strategic decisions need daily data at most. Real-time investment should follow that map, not precede it.
Near-real-time data, updated every 15–60 minutes, covers the majority of operational reporting needs at a fraction of the infrastructure cost. The goal is matching latency to the decision cycle, not chasing the fastest possible refresh rate. MIT Sloan research confirms that real-time data creates lasting value only when paired with empowered employees and integrated workflows. The technology alone does not move the needle.
Key Takeaways
Dynamic reporting delivers its full value only when governance, matched data latency, and self-service access work together inside a single, trusted reporting layer.
| Point | Details |
|---|---|
| Governance before speed | Define KPIs in a governed semantic model before investing in faster data infrastructure. |
| Match latency to decisions | Operational decisions need near-real-time data; strategic decisions work fine with daily refreshes. |
| Self-service reduces bottlenecks | Governed dashboards cut analyst report requests by up to 60%, freeing skilled labor for real analysis. |
| Real-time has limits | Automating batch processes improves data freshness more than streaming infrastructure when upstream quality is poor. |
| Culture drives adoption | Teams that trust their data make faster, more confident decisions across every function. |
The governance gap nobody talks about
Here is what I have seen repeatedly working with growth-stage companies on their reporting systems. The conversation almost always starts with “we need better dashboards.” It almost never starts with “we need to agree on what revenue means.” Those two conversations are not the same, and skipping the second one makes the first one useless.
The organizations that get the most out of dynamic reporting are not the ones with the most charts or the fastest data pipelines. They are the ones that did the unglamorous work of getting finance, marketing, and operations to agree on a shared definition for five or six core metrics. That consensus is the actual product. The dashboard is just the delivery mechanism.
I have also seen the opposite play out. A team builds a beautiful real-time dashboard, and within two weeks, people are back to emailing spreadsheets because the numbers do not match what they expect. The problem is never the technology. It is that nobody owns the definitions. Business analysts who drive real results understand this instinctively. They spend as much time on alignment as on analysis.
The other thing worth saying plainly: most teams do not need real-time data. They need data they trust. Those are different problems with different solutions. Chasing real-time when your upstream processes are still manual is a fast way to spend a lot of money on infrastructure that makes things worse.
— Josh
Rule27design builds reporting systems that teams actually trust
Getting dynamic reporting right requires more than picking a dashboard tool. It requires a governed data layer, role-based access, and a reporting architecture that matches how your team actually makes decisions.

Rule27design builds custom reporting systems for growth-stage companies that have outgrown spreadsheets but do not need enterprise-scale complexity. The work starts with your KPI definitions and decision workflows, then builds a governed semantic layer and interactive dashboards on top. Clients typically see a 40% improvement in operational efficiency after implementation. If your team is still reconciling reports in meetings or waiting two days for numbers that should take four hours, see how Rule27design approaches this and let’s talk about what a purpose-built system could look like for your organization.
FAQ
What is dynamic reporting in business?
Dynamic reporting is an interactive reporting method that pulls from live or near-live data sources and updates automatically. It gives teams self-service access to governed, current data without waiting for manual report generation.
How does dynamic reporting differ from static reporting?
Static reports are fixed snapshots exported at a point in time. Dynamic reports update continuously, allow filtering and drill-down, and pull from a governed semantic model that keeps metrics consistent across teams.
How much time can dynamic reporting save?
Organizations that consolidate analytics tools into a governed dynamic reporting layer have cut weekly reporting time by 60%, reducing two-day reporting cycles to under four hours.
Does every organization need real-time data?
No. Real-time data adds value only when decisions require minute-level windows. Most operational and strategic reporting needs are met by near-real-time data refreshed every 15–60 minutes.
What is the biggest barrier to successful dynamic reporting adoption?
The biggest barrier is lack of governance, not technology. Without agreed KPI definitions in a unified semantic model, dynamic dashboards produce fast but inconsistent data that teams stop trusting quickly.

About the Author
Josh AndersonCo-Founder & CEO at Rule27 Design
Operations leader and full-stack developer with 15 years of experience disrupting traditional business models. I don't just strategize, I build. From architecting operational transformations to coding the platforms that enable them, I deliver end-to-end solutions that drive real impact. My rare combination of technical expertise and strategic vision allows me to identify inefficiencies, design streamlined processes, and personally develop the technology that brings innovation to life.
View Profile

