
Discover how descriptive business analytics can transform your SaaS growth. Learn key metrics, avoid mistakes, and drive actionable insights.
TL;DR:
- Descriptive analytics turns raw data into clear insights about past business performance.
- Focusing on key metrics like MRR, churn, and NRR guides effective decision-making.
- Prioritizing accurate data and regular review prevents costly analytical mistakes.
Most SaaS leaders are sitting on mountains of data. But collecting data and actually using it are two very different things. Many growth-stage companies invest heavily in analytics tools, yet still struggle to answer basic questions like “why did churn spike last quarter?” or “which customer segment drives the most revenue?” Descriptive business analytics is the answer most teams overlook. It turns raw numbers into clear pictures of what actually happened in your business. This article covers what descriptive analytics means, which metrics matter most for SaaS, common mistakes to avoid, and how to put insights into real action.
Key Takeaways
| Point | Details |
|---|---|
| Start with the basics | Descriptive analytics lays the foundation for smarter growth and advanced strategies in SaaS. |
| Prioritize actionable KPIs | Choose 3–5 mission-critical metrics to focus decision-making and avoid dashboard bloat. |
| Data quality drives value | Invest in governance and standardized definitions first to ensure trustworthy insight. |
| Turn insight into action | Leverage descriptive patterns to identify bottlenecks, improve retention, and boost operational efficiency. |
What is descriptive business analytics?
Descriptive business analytics is exactly what it sounds like. It summarizes past and present data to show you what happened in your business. Think of it as the “rear-view mirror” layer of your analytics stack. It tells you where you’ve been so you can navigate where you’re going.
The key outputs are dashboards, trend reports, and summary analyses. A monthly dashboard showing MRR (monthly recurring revenue) growth by segment is descriptive analytics. A report showing churn rate by pricing plan is descriptive analytics. These aren’t fancy, but they’re foundational.
Here’s how descriptive analytics fits into the broader analytics picture:
- Descriptive analytics: What happened? (Churn increased 3% last month.)
- Diagnostic analytics: Why did it happen? (Churn spiked in the mid-market segment after a pricing change.)
- Predictive analytics: What will happen? (Based on trends, churn will rise another 1.5% next quarter.)
- Prescriptive analytics: What should we do? (Adjust pricing for mid-market accounts and trigger a retention campaign.)
As Gartner notes, descriptive analytics serves as the foundation before advancing to predictive or prescriptive analytics. And that’s the key insight most SaaS teams miss. You can’t build a reliable predictive model on shaky descriptive data. Garbage in, garbage out.
For descriptive analytics in SaaS, this means getting precise about which data sources feed your dashboards, how metrics are defined across teams, and how often data is refreshed. If your sales team defines “active user” differently than your product team, every report built on that metric is compromised before anyone even looks at it.
“The value of descriptive analytics isn’t in the complexity of the analysis. It’s in the consistency of the data and the clarity of the output.”
Prioritizing descriptive analytics also prevents a common and costly mistake: rushing to build advanced AI or predictive models on top of unverified historical data. Many SaaS companies burn engineering and analyst time building models that produce misleading signals because the underlying descriptive layer was never properly established. Get the foundation right first.
Essential SaaS metrics for descriptive analytics
Now that you know what descriptive analytics is, let’s examine which specific metrics matter most for SaaS companies. Not every metric deserves your attention. In fact, tracking too many KPIs (key performance indicators) can be just as paralyzing as tracking too few.
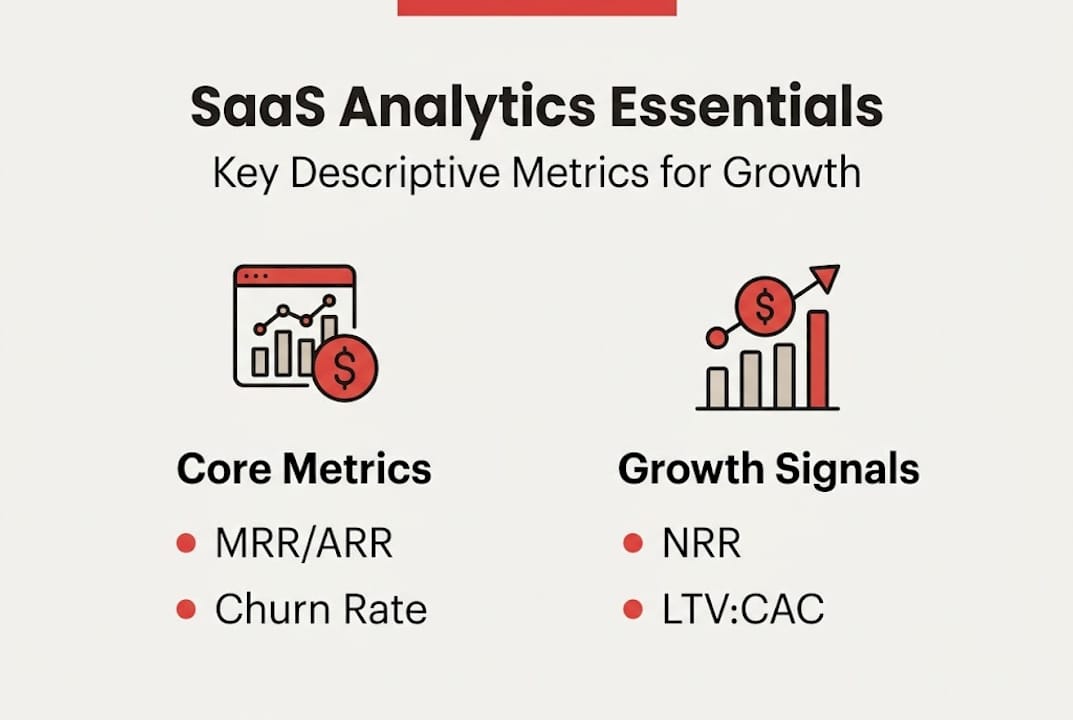
Key SaaS metrics to track include MRR and ARR, churn rate, LTV:CAC ratio, CAC payback period, and net revenue retention (NRR). Here’s a quick breakdown of each and what they reveal:
| Metric | What it measures | Performance benchmark |
|---|---|---|
| MRR/ARR | Total recurring revenue per month or year | Varies by stage; focus on growth rate |
| Churn rate | % of customers or revenue lost per period | Under 5% annually for mid-market SaaS |
| LTV:CAC ratio | Customer value vs. acquisition cost | 3:1 or higher is healthy |
| CAC payback period | Months to recover acquisition cost | Under 12 months for efficient growth |
| NRR | Revenue retained + expansion from existing accounts | Over 110% = top quartile |
One insight that doesn’t get enough airtime: medians are often more useful than averages in SaaS analytics. If five customers each pay $500 per month and one enterprise account pays $50,000, your average contract value is wildly distorted. The median gives you a more honest picture of what’s typical in your customer base.

The risk of “KPI overload” is real. Focusing on 3 to 5 KPIs linked to actual decisions, like MRR by cohort or churn funnels, delivers far more value than tracking twenty metrics that no one reviews consistently. Every KPI on your dashboard should answer a question that someone actually acts on. If you can’t name the decision it informs, cut it.
For teams focused on measuring sales performance, tying revenue metrics to pipeline stages makes descriptive analytics immediately useful. You stop reporting on revenue and start explaining it. Similarly, teams working on optimizing conversions benefit from tracking trial-to-paid conversion rates alongside CAC payback to get a complete picture of acquisition efficiency.
Pro Tip: If your NRR sits above 110%, you’re in top-quartile territory. That means your existing customers are growing faster than you’re losing others. That’s the kind of metric worth celebrating and protecting.
- Track churn by cohort, not just as an overall rate
- Segment MRR by plan type, customer size, and acquisition channel
- Review LTV:CAC quarterly and adjust spend based on payback period trends
- Set thresholds that trigger review when metrics move outside expected ranges
The goal isn’t more data. It’s cleaner, more specific data tied to the questions your team needs to answer every week.
Common pitfalls and quality challenges
Understanding the right metrics is only half the battle. Interpreting them accurately means avoiding common traps that trip up even experienced SaaS analytics teams.
The biggest pitfall? Inaccurate data treated as fact. Teams build dashboards, run reports, and make decisions with total confidence in numbers that are fundamentally flawed. Accurate analysis of inaccurate data is still wrong. And it might actually be worse than no analysis at all, because it gives false confidence.
Other common data quality issues include late or missing events, partial data migrations, metric definitions that shift over time, data drift (where data patterns change without any formal announcement), and outright poor data governance. These aren’t edge cases. They’re the norm in fast-moving SaaS companies where speed often beats rigor.
Here are the steps to avoid the “garbage in, garbage out” trap:
- Define every metric in writing. What exactly counts as “active”? What triggers a churn event? Document it. Share it. Enforce it.
- Audit your data sources quarterly. Check for gaps, duplicates, and inconsistencies before they compound into major reporting errors.
- Version control your metric definitions. When definitions change, note when and why. This allows you to compare like with like over time.
- Validate new data pipelines before using them. Run historical data through new pipelines and compare outputs with known results.
- Assign ownership. Every key metric should have a named owner responsible for its accuracy and freshness.
“One inconsistent definition of churn across sales, finance, and customer success can produce three completely different retention numbers from the same dataset.”
For teams building or upgrading their stack, investing in scalable SaaS analytics tools early pays off significantly. The cost of retrofitting data governance onto a broken system is far higher than building it in from the start. And if you’re looking at broader improving SaaS efficiency initiatives, data quality improvements often produce some of the fastest and most measurable returns.
Pro Tip: Set up a monthly “metrics health” review. Pull your top five KPIs and verify the underlying data. It sounds basic, but it catches drift before it becomes a crisis.
Dashboards that go stale are another underrated problem. A dashboard last updated three months ago isn’t just unhelpful. It’s actively misleading. Automate refresh schedules and flag data that hasn’t been updated within expected windows. Fresh data isn’t optional. It’s the baseline.
From analytics to action: Driving SaaS efficiency and growth
Armed with quality data and focused metrics, let’s turn insights into meaningful action. Descriptive analytics isn’t valuable because it shows you what happened. It’s valuable because it tells you where to look next.
The first step is using descriptive findings to detect bottlenecks and flag anomalies. A sudden drop in feature usage is a classic example. It surfaces in your analytics as a data point, but it signals something much more significant: a potential churn risk that your customer success team needs to address right now, not next quarter. This is how descriptive analytics becomes operational, not just historical.
Here’s a sample of how descriptive findings map to real actions:
| Descriptive finding | Triggered action |
|---|---|
| Churn rate up 2% in enterprise tier | Immediate CS review of at-risk accounts |
| Feature adoption below 20% for new release | Product team investigates onboarding friction |
| CAC payback extending beyond 14 months | Marketing reviews channel spend allocation |
| NRR drops below 105% | Executive review of expansion revenue strategy |
| MRR growth flat for 2 months | Sales investigates pipeline velocity issues |
Fast wins using descriptive analytics:
- Churn fighting: Identify cohorts with early warning signals like low login frequency or declining feature usage, then trigger proactive outreach before accounts formally churn.
- Upsell targeting: Use expansion MRR data to find accounts growing fastest, then prioritize them for upsell conversations while momentum is high.
- Feature adoption tracking: Monitor adoption rates by segment to understand which customer types extract the most value, then use that insight to refine onboarding sequences.
- Pricing plan analysis: Break down churn by plan type to find which pricing tiers are most retention-friendly and where you’re underpricing or overvaluing.
Teams that automate data pipelines get fresher, more reliable inputs, and can use descriptive analytics as the baseline for more advanced AI strategies down the road. Tools like Stripe Sigma make this practical for revenue data, surfacing real-time SaaS insights without custom engineering work. Embedding these tools into daily workflows is what separates teams that react to problems from teams that spot them early.
For companies exploring AI-powered marketing automation, solid descriptive analytics is the prerequisite. AI models are only as good as the historical data they learn from. And for teams tracking website analytics for growth, tying web behavior data to product usage metrics creates a much richer picture of the full customer journey.
NRR above 110% consistently correlates to top-quartile SaaS performance. That benchmark isn’t arbitrary. It means your existing customer base is a growth engine on its own, even without new customer acquisition. Building descriptive systems that monitor and protect NRR is one of the highest-leverage analytics investments you can make.
A fresh perspective: Why most SaaS teams underestimate descriptive analytics
Here’s the uncomfortable truth: most SaaS startups rush past descriptive analytics because it feels boring. Predictive models and AI-driven insights sound exciting. Dashboards showing last month’s churn rate don’t. So teams skip ahead, invest in advanced tooling, and then wonder why their models produce unreliable outputs.
The “boring” work of descriptive analytics, standardizing metric definitions, running regular data audits, building clean dashboards tied to real decisions, is actually the most valuable analytical work a growth-stage SaaS team can do. It creates the institutional knowledge that prevents costly mistakes when the business scales.
Real growth accelerates when teams commit to reviewing descriptive data routinely and acting on the anomalies it surfaces. Not because the anomalies are dramatic, but because catching a 2% churn increase in month two beats discovering a 15% retention problem in month eight.
Teams that invest in content-driven strategies alongside their analytics work often find that the discipline carries over. Consistent measurement, regular review, clear ownership. The mindset is the same. The payoff is compounding. Start with the foundation. Build descriptive analytics properly. Everything else gets easier from there.
Take SaaS analytics to the next level with expert help
You’ve got the framework. Now it’s about execution. Building clean descriptive analytics systems takes more than good intentions. It takes the right infrastructure, the right tooling, and the right architecture for how your team actually works.
At Rule27 Design, we build custom admin panels, business intelligence dashboards, and internal analytics tools that fit growth-stage SaaS companies exactly. Not off-the-shelf, not enterprise overkill. Just clean systems that surface the metrics your team needs to act fast. Our Innovation Lab for SaaS is where we prototype and build analytics solutions tailored to your specific workflows. Ready to stop guessing and start growing? Let’s talk.
Frequently asked questions
What are the top descriptive business analytics metrics for SaaS?
Key metrics include MRR and ARR, churn rate, LTV:CAC ratio, CAC payback period, and net revenue retention (NRR). These five give you a clear, actionable picture of revenue health and growth efficiency.
Why is data quality important in descriptive analytics?
Inaccurate data produces flawed insights regardless of how sophisticated your dashboard is. Bad data leads directly to bad decisions, even when the analysis itself is technically sound.
How do descriptive analytics impact SaaS growth?
They help you spot trends, identify churn risk signals like drops in feature usage, and drive focused operational improvements. The earlier you see a problem, the cheaper it is to fix.
When should SaaS leaders move from descriptive to predictive analytics?
Only after you’ve established reliable data quality and consistent metric definitions should you invest in predictive models. Building on a shaky descriptive foundation wastes time and produces misleading predictions.
What’s a quick way to start with descriptive analytics in SaaS?
Automate your data pipelines, lock in 3 to 5 core metrics tied to real decisions, and schedule a weekly review. You’ll have actionable insights within the first month.

About the Author
Josh AndersonCo-Founder & CEO at Rule27 Design
Operations leader and full-stack developer with 15 years of experience disrupting traditional business models. I don't just strategize, I build. From architecting operational transformations to coding the platforms that enable them, I deliver end-to-end solutions that drive real impact. My rare combination of technical expertise and strategic vision allows me to identify inefficiencies, design streamlined processes, and personally develop the technology that brings innovation to life.
View Profile

