
Discover the role of configurable analytics in growth-stage SaaS. Learn how it enhances trust, boosts revenue, and reduces churn effectively.
TL;DR:
- Configurable analytics provides a flexible layer to control metrics behavior without altering underlying definitions. It enhances data trustworthiness, drives revenue growth, and reduces churn when properly separated from data governance. A strong governance foundation improves AI accuracy, saves engineering time, and ensures reliable analytics as companies scale.
Configurable analytics is defined as the flexible layer that controls how analytics behave across dashboards, reports, and AI queries without touching the underlying metric definitions. The role of configurable analytics goes well beyond display preferences. It determines whether your data stays trustworthy as your team grows, your product evolves, and AI agents start querying your metrics automatically. Growth-stage SaaS companies that get this right see 20% revenue increases and cut churn among analytics-active users by 30–40%. The companies that get it wrong end up with dashboards nobody trusts and AI outputs nobody can explain.
What is the role of configurable analytics in data governance?
Configurable analytics and data governance are not the same thing. Confusing them is one of the most expensive mistakes a growth-stage team can make.
Governed metrics are fixed. They define what “monthly recurring revenue” means, how churn is calculated, and which data sources feed each number. These definitions live in a central layer, like Databricks Unity Catalog or a dedicated semantic layer, and they do not change based on who is viewing the dashboard.
Configuration, by contrast, controls behavior. It manages default date ranges, sorting preferences, filter states, and display formats. Configuration answers the question “how should this metric appear in this context?” Governance answers “what does this metric mean?”
Separating these two concerns is what prevents semantic drift. Semantic drift happens when different teams start applying different logic inside configuration layers, so “revenue” means one thing to the sales dashboard and something slightly different to the finance report. Over time, nobody agrees on the numbers, and trust collapses.
Here is what a clean separation looks like in practice:
- Governed layer: Metric name, formula, data source, owner, refresh cadence
- Configuration layer: Default filters, sort order, chart type, user role visibility
- Presentation layer: Colors, labels, layout, export options
Pro Tip: When building or auditing your analytics stack, run a simple test. Ask three people from different teams to pull the same metric independently. If they get different numbers, your governance layer has leaked into your configuration layer. Fix the definitions before touching the display settings.
Modernizing analytics requires architectural decisions prioritizing metric governance rather than simply moving dashboards to the cloud. Moving fast without this foundation just scales the confusion.
What measurable benefits does configurable analytics deliver?
The business case for getting configurable analytics right is not abstract. The numbers are specific and they compound.

SaaS companies that embed analytics directly into their products report a 20% revenue increase alongside 30–40% lower churn among users who actively engage with those analytics features. They also save 6–12 months of engineering time compared to building equivalent functionality in-house. That time savings alone changes the economics of a growth-stage product roadmap.
Analytics maturity explains 72% of the variance in organizational performance across companies studied. That is a strong correlation. It means the gap between companies with mature, configurable analytics and those without is not a minor efficiency difference. It is a structural performance gap.
Here is a comparison of typical outcomes across different analytics approaches:
| Approach | Engineering time | Metric consistency | AI readiness | User adoption |
|---|---|---|---|---|
| Off-the-shelf BI tools | Low setup | Low (siloed) | Poor | Moderate |
| Full custom build | Very high | High (if governed) | Moderate | High |
| Composable analytics | Moderate | High | Strong | High |
| Embedded configurable analytics | Low to moderate | High | Strong | Highest |
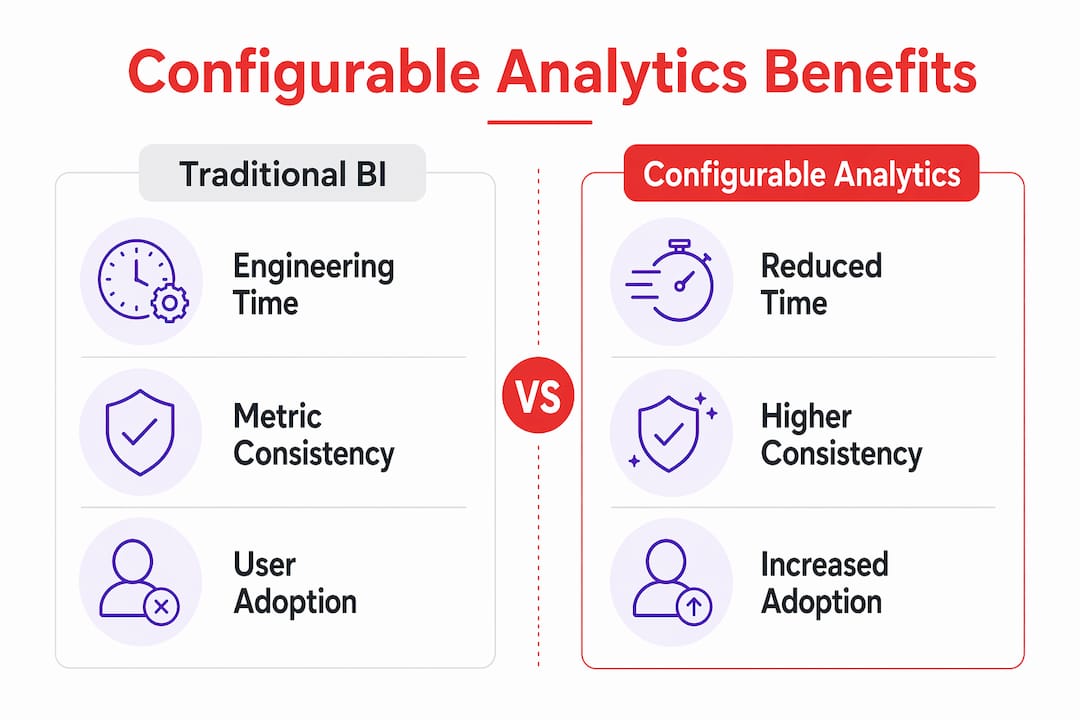
Embedded analytics outperforms standalone BI because it meets users inside the workflows they already use. A sales rep who sees churn risk scores inside their CRM acts on that data. The same data sitting in a separate BI tool gets ignored. Context drives adoption, and adoption drives the revenue and retention numbers above.
For business analysts at growth-stage companies, the practical implication is this: the importance of configurable analytics is not just about cleaner dashboards. It is about building a data layer that your whole organization actually uses, and that your AI tools can query reliably.
How does configurable analytics power AI integration?
AI agents need clean, consistent, machine-readable data to work well. Configurable analytics with a strong governance foundation is what makes that possible.
A composable semantic layer, which encodes metric definitions in a structured, versioned schema, boosts AI query accuracy from 40% to 83% and reduces hallucinations by 22%. It also speeds AI deployment by 28%, with an average $3.4M annual business impact per organization. Those are not marginal gains. They reflect the difference between an AI assistant that gives confident wrong answers and one that gives reliable right ones.
The reason is straightforward. When an AI agent queries “what was our churn last quarter,” it needs to know exactly which churn definition to use, which data source to pull from, and whether the result has been validated. A governed semantic layer provides all three. Without it, the AI guesses, and guesses at scale are expensive.
Modern approaches like Metrics Control Plane interfaces give AI agents structured access to validated metric stores. The AI does not write raw SQL against your database. It queries a governed layer that returns consistent, audited results.
Here is what a production-ready analytics foundation for AI requires:
- Versioned metric schemas: Every metric definition has a version history so changes are traceable
- CI/CD testing for data pipelines: Governed data foundations require strict schemas and automated review processes before any metric definition changes go live
- Audit trails: Every query, every result, and every definition change is logged
- Machine-readable metadata: Metric descriptions, owners, and lineage are stored in formats AI agents can parse
Pro Tip: Treat your analytics layer the way your engineering team treats production code. Version it, test it, and review changes before they ship. Analytics that reaches AI agents or executive dashboards needs the same rigor as your core product.
Analytics is core infrastructure once it is relied upon for decisions. The companies that recognize this early build systems that scale. The ones that treat it as a reporting afterthought rebuild from scratch later, at much higher cost.
Composable analytics vs. custom builds vs. off-the-shelf tools
Three architectural approaches dominate the configurable analytics space. Each makes a different trade-off between control, speed, and long-term flexibility.
Off-the-shelf BI platforms like Tableau or Power BI are fast to deploy and require minimal engineering. The trade-off is that they are built for generic use cases. You configure within their constraints, not yours. Metric governance is often bolted on rather than built in, and embedding these tools inside your product is either impossible or visually jarring.
Full custom builds give you complete control. Your metric definitions, your UI, your data pipeline. The cost is 6–12 months of engineering time upfront and ongoing maintenance that pulls engineers away from product work. For most growth-stage companies, this is overkill until the product has proven the need.
Composable analytics sits in the middle. Composable analytics uses pre-built SDK components that handle the hard backend problems: query generation, caching, security, and data modeling. You control the styling, the user experience, and the integration points. The result is a custom-feeling product built in weeks rather than months.
The composable approach also maps cleanly onto the governance-versus-configuration distinction covered earlier. The SDK handles the infrastructure. You define the metrics. Configuration controls the behavior. Each layer stays in its lane.
For SaaS companies building analytics into their products, composable analytics is the architecture that scales. It lets you ship fast, maintain governance, and add AI capabilities without rebuilding the foundation. The advantages of customizable analytics built on composable principles show up most clearly when a company needs to add a new customer segment, a new metric, or a new AI feature without a three-month engineering sprint.
Key Takeaways
Configurable analytics delivers its full value only when governance and configuration are treated as separate, distinct layers with clear ownership and strict boundaries.
| Point | Details |
|---|---|
| Governance and configuration are separate | Metric definitions belong in a governed layer; display behavior belongs in configuration. Mixing them causes semantic drift. |
| Business impact is measurable | Embedded configurable analytics drives 20% revenue growth and 30–40% churn reduction for SaaS companies. |
| AI accuracy depends on governed metrics | A composable semantic layer improves AI query accuracy from 40% to 83% and cuts hallucinations by 22%. |
| Composable architecture balances speed and control | SDK-based composable analytics saves 6–12 months of engineering time while maintaining governance and flexibility. |
| Analytics maturity predicts performance | Analytics capability explains 72% of variance in organizational performance, making it a structural business advantage. |
Why governance-first is the only analytics strategy that ages well
Here is what I have seen repeatedly working with growth-stage companies: teams build fast, ship dashboards, and defer the governance question. It feels fine for the first 12 months. Then the company hits 50 employees, adds a second product line, or starts integrating AI tools, and the whole thing falls apart.
The problem is not the dashboards. The problem is that nobody ever decided what “active user” means, so now sales, product, and finance each have a different number. Every meeting starts with 20 minutes of reconciling data instead of making decisions.
The governance-first approach feels slower at the start. You spend time defining metrics, assigning owners, and building a semantic layer before you build the first dashboard. But that investment pays back fast. When you add a new AI feature, it queries validated metrics. When you hire a new analyst, they inherit clear definitions. When a board member asks a question, everyone in the room has the same answer.
I also think the future of analytics is closer to what future analytics platforms will act as: context platforms that encode organizational meaning into governed semantic layers. Metrics become the primary API for both human decisions and AI strategy. That future is already here for companies that have done the governance work. For companies that have not, it is a significant catch-up project.
The practical advice is simple. Start with your top 10 metrics. Define them precisely. Assign an owner to each. Put them in a governed layer. Then build configuration on top of that. You will ship slower for one sprint and faster for every sprint after.
— Josh
Build your analytics foundation with Rule27design
Ready to move from scattered dashboards to a governed, configurable analytics system that actually scales?
Rule27design builds custom analytics infrastructure for growth-stage companies that have outgrown basic tools but do not need enterprise complexity. From composable semantic layers to embedded analytics products, the team at Rule27design designs systems around how your team actually works. Clients typically see 40% gains in operational efficiency after implementation. Explore the Innovation Lab to see how Rule27design can help you build an analytics architecture that supports both your current decisions and your future AI strategy.
FAQ
What is configurable analytics?
Configurable analytics is the layer that controls how metrics behave across dashboards, reports, and AI queries without changing the underlying metric definitions. It manages defaults, filters, sorting, and display preferences at the context level.
How does configurable analytics differ from data governance?
Data governance defines what metrics mean and how they are calculated. Configurable analytics controls how those metrics are displayed and filtered in different contexts. Separating these two layers prevents semantic drift and keeps reporting consistent across teams.
What are the main configurable analytics benefits for SaaS companies?
SaaS companies using embedded configurable analytics report a 20% revenue increase and 30–40% lower churn among analytics-active users, plus 6–12 months saved in engineering time compared to custom builds.
How does configurable analytics improve AI performance?
A governed semantic layer gives AI agents access to validated, versioned metric definitions. This improves AI accuracy from 40% to 83% and reduces hallucinations by 22%, making AI outputs reliable enough to act on.
What is composable analytics and how does it relate to configurable analytics?
Composable analytics uses modular SDK components to handle backend complexity like query generation and security, while giving developers control over UX and integration. It is the architectural approach that makes configurable analytics practical to build and maintain at growth-stage scale.

About the Author
Josh AndersonCo-Founder & CEO at Rule27 Design
Operations leader and full-stack developer with 15 years of experience disrupting traditional business models. I don't just strategize, I build. From architecting operational transformations to coding the platforms that enable them, I deliver end-to-end solutions that drive real impact. My rare combination of technical expertise and strategic vision allows me to identify inefficiencies, design streamlined processes, and personally develop the technology that brings innovation to life.
View Profile

