
Unlock business growth with a step-by-step custom analytics setup. Learn to plan, integrate, and validate analytics for actionable insights in any team.
Did you know that over 72 percent of business leaders say clear analytics are key to their success? Without the right data and tools, reaching your goals can feel impossible. Sharpening your focus on meaningful metrics and setting up a reliable analytics framework can help you move from guesswork to confident decisions. Discover how to lay the foundation for smarter data-driven strategies that actually support real business growth.
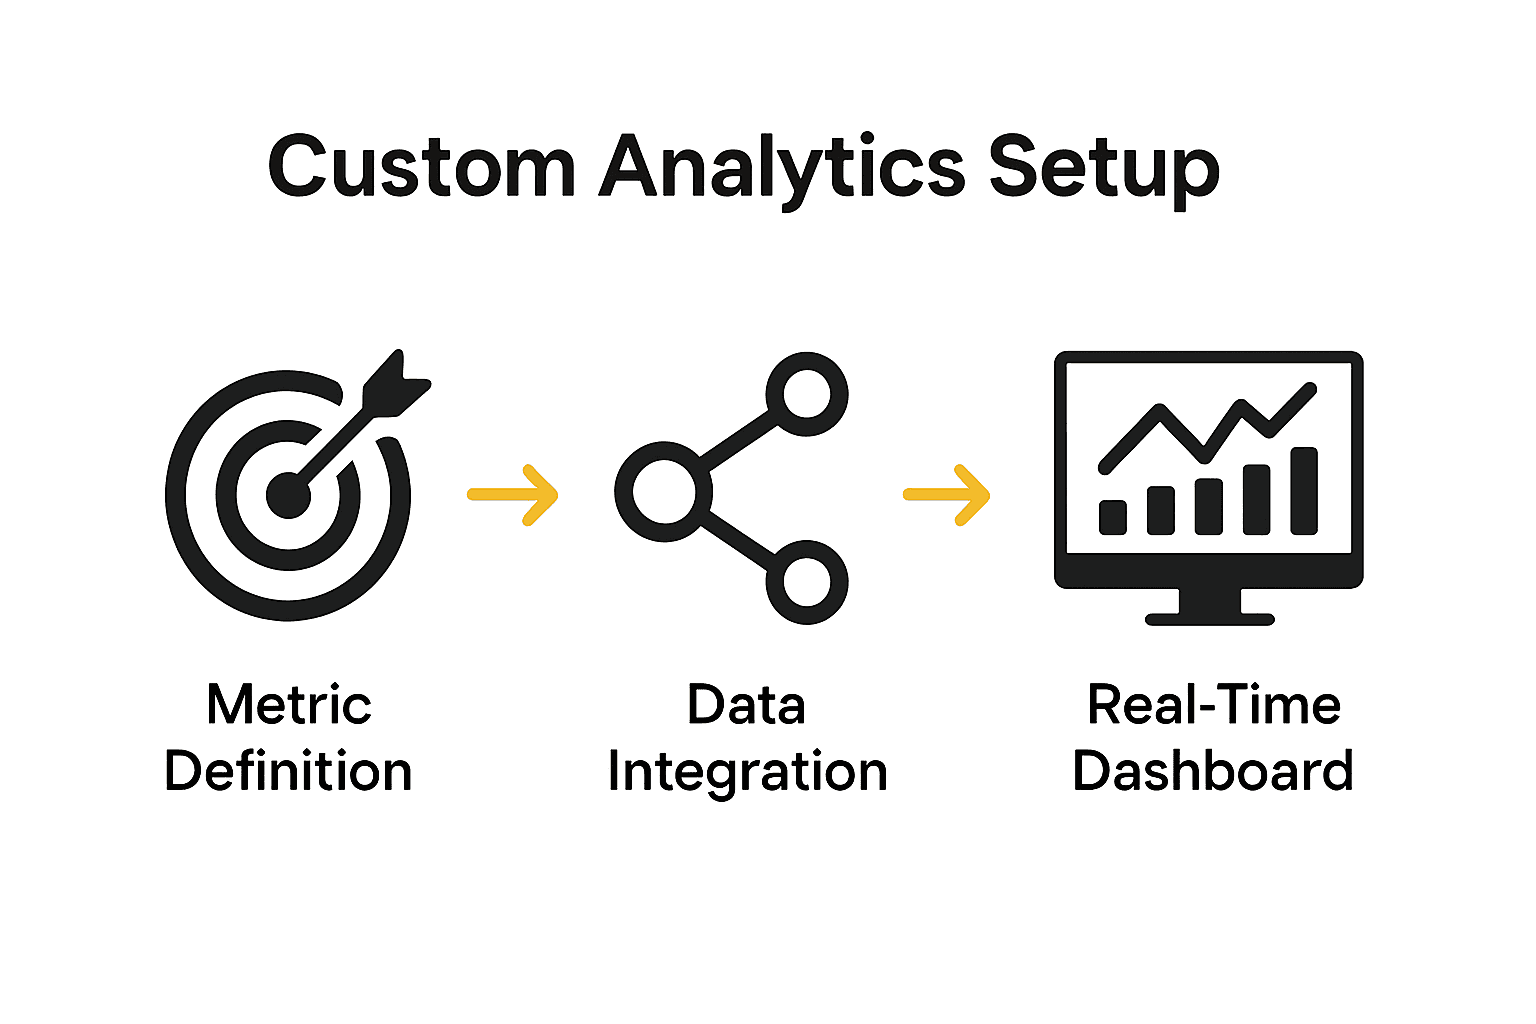
Step 1: Define key metrics and analytics requirements
In this step, you will create a strategic roadmap for understanding exactly what data matters most for your business objectives. The goal is to transform vague aspirations into precise, measurable analytics targets.
Start by zeroing in on your core business goals. What specific outcomes are you seeking? Are you aiming to improve customer retention, boost sales conversion rates, or optimize marketing spend? According to research from exact buyer analytics, the process begins with clearly identifying your primary business objectives before diving into metrics.
Once you understand your goals, map out specific analytics requirements that directly support those objectives. For example, if increasing customer retention is your aim, relevant metrics might include customer lifetime value, churn rate, repeat purchase frequency, and satisfaction scores. Break these down into quantitative and qualitative measurements to get a comprehensive view.
Prioritization is key. Not all metrics carry equal weight. Evaluate each potential metric based on its potential impact and alignment with strategic goals. Focus on indicators that provide actionable insights rather than collecting data just because you can.
Pro Tip: When defining metrics, ensure they are SMART - Specific, Measurable, Achievable, Relevant, and Time-bound.
As you document your metrics, pay close attention to data quality. According to TechTarget, this means establishing clear standards for accuracy, completeness, consistency, and timeliness. Check for potential data gaps or collection challenges before fully implementing your analytics framework.
By the end of this step, you will have a clear, targeted set of metrics that transform raw data into meaningful business intelligence. In the next section, we will explore how to set precise targets and benchmarks for these metrics.
Here’s a summary of key metrics and their analytics requirements:
| Objective | Example Metrics | Quantitative | Qualitative |
|---|---|---|---|
| Customer Retention | Lifetime Value Churn Rate |
Purchase Frequency | Satisfaction Scores |
| Sales Conversion | Conversion Rate Average Order Value |
Cart Abandon Rate | Customer Feedback |
| Marketing Optimization | ROI Cost per Lead |
Acquisition Rate | Campaign Sentiment |
| Product Performance | Usage Rate Return Rate |
Feature Adoption | User Reviews |
Step 2: Select and prepare data sources for integration
In this step, you will identify, evaluate, and prepare the data sources that will power your analytics strategy. The goal is to create a robust and reliable data integration framework that transforms raw information into meaningful insights.
Begin by mapping out all potential data sources across your organization. These might include customer relationship management systems, web analytics platforms, sales databases, social media channels, and financial tracking tools. According to research from TechTarget, understanding your specific analytics use case is critical for selecting the most appropriate data sources.
Prioritize your data sources based on three key criteria: completeness, consistency, and timeliness. Not all data is created equal. Look for sources that provide comprehensive, up-to-date information with minimal gaps or discrepancies. This means scrutinizing each potential source for its reliability and relevance to your defined metrics.
Next, focus on data integration strategies. Research from CoreCastre suggests using open formats like JSON, XML, and CSV to link multiple data sources via APIs. Create a master dataflow that includes robust validation and caching mechanisms to ensure data integrity and performance.
Pro Tip: Develop a comprehensive data dictionary that standardizes definitions across different sources, ensuring long-term interoperability and consistent interpretation.
Utilize Extract, Transform, Load (ETL) tools with strong error-handling and logging capabilities. These tools will help you clean, normalize, and prepare your data for analysis. Pay special attention to potential inconsistencies in data formats, missing values, and duplicate entries that could skew your analytics results.

By the end of this step, you will have a carefully curated set of data sources integrated into a unified, reliable framework. In the next section, we will explore how to design and implement your data transformation processes.
Step 3: Implement custom tracking using tailored tools
In this step, you will design and implement a precision tracking system that captures the nuanced data essential to your specific business objectives. The goal is to create a custom tracking approach that goes beyond generic analytics solutions and provides deeply relevant insights.
Start by identifying the unique metrics that matter most to your organization. This means moving beyond standard out-of-the-box tracking and designing custom event tracking that aligns perfectly with your strategic goals. Consider the specific user interactions, conversion points, and performance indicators that truly reflect your business performance.
Choose tracking tools that offer flexibility and deep customization. Your selected platform should allow you to create custom events, tags, and tracking parameters that capture the exact data points you need. This might involve setting up specialized event tracking for specific user journeys, creating custom conversion funnels, or designing unique attribution models.
According to research from WebBB AI, implementing robust accuracy validation is critical when developing custom tracking systems. This means establishing multiple verification techniques to ensure data reliability. Cross-platform consistency checks, manual test transactions, and statistical analysis can help validate the accuracy of your tracking implementation.
Pro Tip: Create a comprehensive data quality scorecard that tracks the reliability and consistency of your custom tracking metrics across different platforms and touchpoints.
Implement tracking mechanisms that capture both quantitative and qualitative data. Go beyond simple numerical metrics by incorporating contextual information that provides deeper insights into user behavior. This might include tracking user paths, interaction timestamps, device information, and contextual metadata that adds richness to your analytics.
Ensure your tracking setup includes comprehensive error handling and logging capabilities. Build in mechanisms to detect and alert you about tracking discrepancies, missing data points, or potential integration issues. This proactive approach will help maintain the integrity of your analytics system.
By the end of this step, you will have a robust, custom tracking system that provides precise insights tailored specifically to your business needs.
In the next section, we will explore how to design dashboards that transform these tracking insights into actionable intelligence.
Step 4: Configure real-time dashboards and reporting workflows
In this step, you will transform your collected data into dynamic, actionable visual interfaces that provide instant insights into your business performance. The goal is to create intuitive dashboards that turn complex data streams into clear, meaningful information.
Begin by designing a dashboard architecture that balances real-time updates with historical context. According to Business Anywhere research, effective dashboards should offer live updates while maintaining the ability to compare current metrics against past performance. This means creating visual interfaces that show immediate data changes alongside trend analyses.
Focus on customizable visual representations that match your specific business needs. Select dashboard tools that allow you to create flexible layouts, interactive charts, and personalized views for different stakeholder groups. Your dashboard should enable users to drill down into specific metrics, filter data dynamically, and gain granular insights with minimal effort.
Implement smart alert mechanisms that notify key team members about significant changes or threshold breaches. Design these alerts to be specific and actionable rather than generating noise. According to Design Gurus, using push mechanisms like WebSockets can enable real-time client updates with minimal system lag.
Pro Tip: Set precise alert thresholds that reflect meaningful business variations to prevent alert fatigue and ensure team members receive only truly significant notifications.
Ensure robust security and compliance in your dashboard configuration. This means implementing role-based access controls, data encryption, and maintaining clear audit trails. Your dashboard should protect sensitive information while providing transparency for authorized users.
Optimize dashboard performance through strategic query tuning and intelligent caching mechanisms. This involves selecting database technologies that support low-latency metric computation and can handle stream processing efficiently.
 Consider using in-memory or time-series storage solutions that enable rapid data retrieval and visualization.
By the end of this step, you will have a powerful, real-time reporting system that transforms raw data into actionable intelligence. In the next section, we will explore how to continuously refine and improve your analytics infrastructure.
Step 5: Validate analytics accuracy and optimize performance
In this step, you will establish a robust validation framework that ensures the reliability and precision of your analytics system. The goal is to create multiple layers of verification that catch potential data inaccuracies and maintain the highest standards of performance and trustworthiness.
Begin by embedding comprehensive data validation techniques throughout your entire analytics pipeline. According to research from Sift AG, this means implementing a multi-layered approach that checks data across various dimensions. Create validation rules that examine data types, value ranges, format consistency, uniqueness, and presence of critical information.
Deploy both automated and manual validation methods to create a comprehensive verification system. Automated checks can quickly scan large datasets for obvious anomalies, while periodic manual reviews can catch more nuanced discrepancies. Your validation strategy should include cross-referencing data sources, statistical sampling, and systematic error tracking.
According to research from Vorecol, implementing advanced anomaly detection algorithms can significantly enhance data reliability. These sophisticated tools can identify unexpected patterns or outliers that might indicate data collection issues or systemic errors. By proactively detecting these anomalies, you can address potential problems before they impact your analytics insights.
Pro Tip: Establish a data quality scorecard that tracks validation results, error rates, and correction actions to create a transparent and continuously improving analytics environment.
Create a systematic monitoring approach that tracks performance metrics for your analytics infrastructure. This includes measuring system latency, query response times, data processing speeds, and resource utilization. Regularly review these performance indicators to identify potential bottlenecks or areas for optimization.
Set up automated alerts that notify your team about significant data quality issues or performance degradations. Configure these alerts to provide detailed context, allowing your team to quickly understand and address any emerging challenges. The goal is to create a proactive monitoring system that maintains the highest standards of data accuracy and system performance.
By the end of this step, you will have a rigorous validation framework that ensures the reliability and accuracy of your analytics system. In the final section, we will explore strategies for continuous improvement and adaptation of your analytics infrastructure.
Unlock Analytics Success With Tailored Digital Infrastructure
Struggling to turn complex metrics and fragmented data sources into clear, actionable insights? This article shows how crucial it is to track custom events, build real-time dashboards, and maintain data quality throughout your analytics journey. Yet many teams still hit a wall with off-the-shelf tools or solutions that do not flex to their workflow. That leads to lost opportunities and unreliable reporting.
Move beyond generic analytics and discover the impact of a custom-built system. At Rule27 Design, we specialize in creating administrative platforms and business intelligence solutions grounded in your real operations. If you see yourself in any of these pain points
- Need to define SMART metrics and high-impact KPIs
- Frustrated by scattered data sources and integration headaches
- Challenged by inconsistent analytics or dashboards that don’t reflect real business needs then our solutions are made for you.
Ready to turn your analytics strategy into practical business results? Work with a partner that understands both technical architecture and your goals. Explore how our custom admin panels and content management systems deliver results you can trust. Visit Rule27 Design to start your journey to reliable, scalable analytics today and see why our clients achieve breakthrough efficiency and content visibility.
Frequently Asked Questions
What are the key metrics to define when setting up custom analytics?
Define key metrics aligned with your business goals, such as customer lifetime value, churn rate, and conversion rates. Start by directly associating these metrics with specific outcomes to ensure they provide actionable insights.
How do I prioritize which metrics to track for scalable insights?
Prioritize metrics based on their potential impact on your strategic goals. Focus on those that provide the most actionable insights, and aim to track around 5 to 10 key metrics to avoid data overload.
What steps should I follow to integrate data sources effectively?
Begin by mapping out all potential data sources and evaluating them for completeness and reliability. Choose a set of sources that provide consistent, up-to-date information, and implement ETL tools to prepare the data for analysis.
How can I ensure the accuracy of my custom analytics system?
Establish a comprehensive validation framework that includes both automated and manual checks for data accuracy. Implement error-tracking mechanisms and conduct periodic reviews to catch inconsistencies and ensure high data reliability.
What features should I include in my real-time dashboards?
Design dashboards that offer live updates, customizable views, and easy drill-down options for different stakeholders. Incorporate smart alert functionalities that notify your team of significant changes or threshold breaches to maintain timely awareness of key performance indicators.
How often should I review and optimize my analytics setup?
Regularly review your analytics performance monthly or quarterly to identify bottlenecks and areas for improvement. Setting clear performance benchmarks during these reviews can lead to actionable adjustments that enhance data-driven decision-making.

About the Author
Josh AndersonCo-Founder & CEO at Rule27 Design
Operations leader and full-stack developer with 15 years of experience disrupting traditional business models. I don't just strategize, I build. From architecting operational transformations to coding the platforms that enable them, I deliver end-to-end solutions that drive real impact. My rare combination of technical expertise and strategic vision allows me to identify inefficiencies, design streamlined processes, and personally develop the technology that brings innovation to life.
View Profile

